
So much for playing better. The Wizards hosted the Minnesota Timberwolves — on the fourth game of a four-game road trip and the second night of a back-to-back — and got vanquished, 141-115. The game was not that close.
The Timberwolves scored at least 33 in every quarter and coasted to a 134 offensive rating. Anthony Edwards scored 35 points in 30 minutes, and then sat the entire fourth quarter. He engaged in activities like giving his game jersey to a young woman wearing a Matilda shirt (apparently Edwards’ favorite movie) and signing autographs for kids.

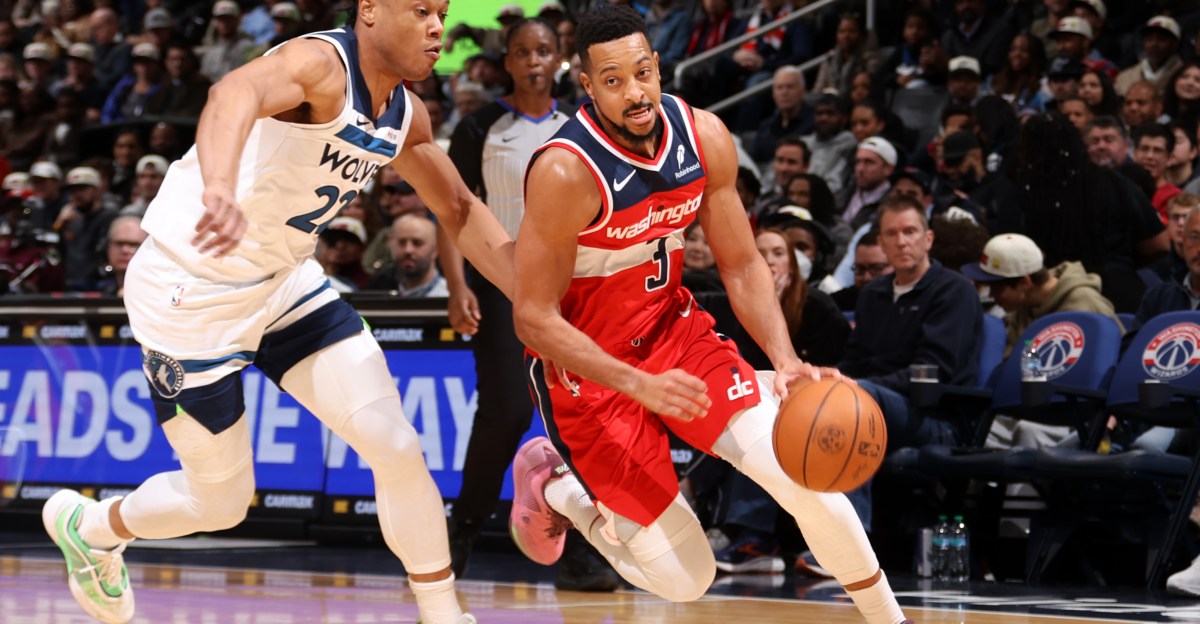
Wizards guard CJ McCollum scored 20 points in 22 minutes in the team’s loss to the Minnesota Timberwolves. NBAE via Getty Images
Rudy Gobert dominated inside against fellow countryman Alex Sarr, going for 18 points, 14 rebounds, and 4 blocks. He pushed around Sarr at will inside, gathering six offensive boards.
For the Wizards, there’s not much good to say. CJ McCollum led the team with 20 points in 22 minutes. Khris Middleton scored 10 points on 6 shots.
No one effectively defended anyone really. In the early going, it looked like Bilal Coulibaly might do a passable job on Edwards, but the Timberwolves guard scored on an array of drives, threes, and transition plays. Coulibaly’s defensive efforts were thoroughly ineffective.
Below are the four factors that decide wins and losses in basketball — shooting (efg), rebounding (offensive rebounds), ball handling (turnovers), fouling (free throws made).
The four factors are measured by:
eFG% (effective field goal percentage, which accounts for the three-point shot)OREB% (offensive rebound percentage)TOV% (turnover percentage — turnovers divided by possessions)FTM/FGA (free throws made divided by field goal attempts)FOUR FACTORSTIMBERWOLVESWIZARDSLGAVGeFG%61.7%55.7%54.5%OREB%39.5%20.9%26.2%TOV%13.3%18.1%12.8%FTM/FGA0.2040.1930.216PACE105100.0ORTG134110115.9
PPA is my overall production metric, which credits players for things they do that help a team win (scoring, rebounding, playmaking, defending) and dings them for things that hurt (missed shots, turnovers, bad defense, fouls).
PPA is a per possession metric designed for larger data sets. In small sample sizes, the numbers can get weird. In PPA, 100 is average, higher is better and replacement level is 45. For a single game, replacement level isn’t much use, and I reiterate the caution about small samples sometimes producing weird results.
POSS is the number of possessions each player was on the floor in this game.
ORTG = offensive rating, which is points produced per individual possessions x 100. League average so far this season is 115.1. Points produced is not the same as points scored. It includes the value of assists and offensive rebounds, as well as sharing credit when receiving an assist.
USG = offensive usage rate. Average is 20%.
ORTG and USG are versions of stats created by former Wizards assistant coach Dean Oliver and modified by me. ORTG is an efficiency measure that accounts for the value of shooting, offensive rebounds, assists and turnovers. USG includes shooting from the floor and free throw line, offensive rebounds, assists and turnovers.
+PTS = “Plus Points” is a measure of the points gained or lost by each player based on their efficiency in this game compared to league average efficiency on the same number of possessions. A player with an offensive rating (points produced per possession x 100) of 100 who uses 20 possessions would produce 20 points. If the league average efficiency is 114, the league — on average — would produced 22.8 points in the same 20 possessions. So, the player in this hypothetical would have a +PTS score of -2.8.
Players are sorted by total production in the game.
WIZARDSMINPOSSORTGUSG+PTSPPA+/-CJ McCollum224813128.3%2.1174-8Khris Middleton183917312.6%2.8136-6Tristan Vukcevich132913323.0%1.11275Justin Champagnie184010614.2%-0.579-23AJ Johnson132810921.3%-0.41086Bilal Coulibaly28601168.6%0.040-24Bub Carrington17388726.4%-2.952-25Corey Kispert184010426.9%-1.348-26Will Riley14308922.6%-1.849-2Tre Johnson27599824.1%-2.516-6Alex Sarr26577819.7%-4.2-6-16Marvin Bagley III14309319.1%-1.3-22-23Anthony Gill51120815.9%1.73307Malaki Branham71514016.1%0.610511TIMBERWOLVESMINPOSSORTGUSG+PTSPPA+/-Anthony Edwards306613632.0%4.332029Rudy Gobert296417416.1%5.926232Jaylen Clark286017712.5%4.623019Jaden McDaniels224818716.2%5.523114Julius Randle255515025.6%4.817416Mike Conley132816219.1%2.523510Naz Reid204411819.7%0.212319Bones Hyland153413819.3%1.4911Donte DiVincenzo23497018.2%-4.15728Johnny Juzang91910123.9%-0.754-9Leonard Miller11238426.7%-2.015-11Joe Ingles8182133.8%0.764-7Rob Dillingham715021.6%-3.9-386-11