
With two days off between games, it’s time for a Washington Wizards checkup. After a 5-2 binge (7-5 over a 12-game stretch), their record stands at 10-28. That’s the fourth worst winning percentage in the league, and more or less in line with what the oddsmakers thought — preseason over/under lines pegged them as a 20-win team.
My own expectations were worse. I estimated them to win 15 games, which a) is theoretically possible, and b) would mean a brutal second half of the season.

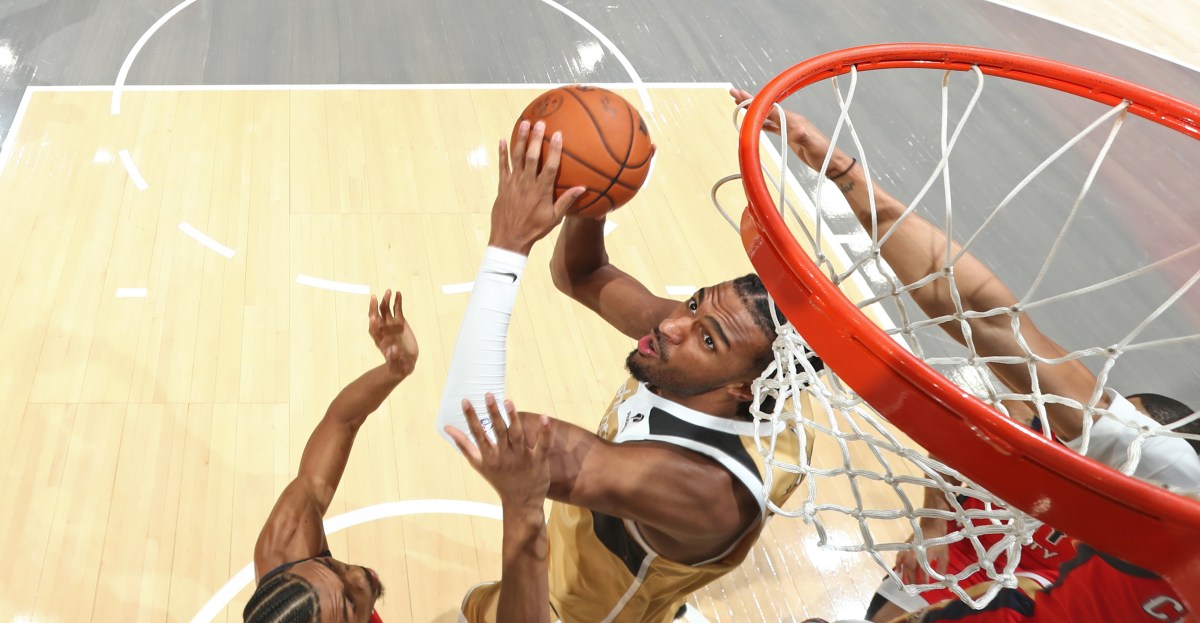
Washington Wizards big man Alex Sarr is emerging as a quality NBA player in his second campaign with the team. NBAE via Getty Images
Advanced stat indicators of team strength have improved during this winning stretch, though they’re still indicative of the league’s weakest team. Barring a painful reversion to earlier form, they have likely ended the possibility of being the worst team (single season) in league history.
With 10 wins, they’re already out of history danger territory in terms of record and winning percentage. The 1972-73 Philadelphia 76ers managed just nine wins with 10 victories. If they lose every remaining game, they’d have a 12.2% winning percentage, which would still be slightly better than the 10.6% posted by the 2011=12 Charlotte Bobcats So they have that going for them.
Over that 7-5 run, the team posted an offensive rating (points per 100 possessions) of 114.8 (about a point below league average) and a defensive rating of 115.8 (right at league average). That’s some genuine improvement, and it’s a long enough stretch to think it marks some real improvement. This is not to say they’ve become a league average team — but rather that they’re probably better than “worst ever” and Wizards fans can have real reason to hope the team might become decent-to-good in the future.
Better measures of team strength are related to score — scoring margin, efficiency margin, or strength of schedule adjusted scoring margin. For the season, the Wizards adjusted scoring margin is a league worst -10.6. That’s nearly two points per 100 possessions better than their adjusted scoring margin a month ago. They currently sit at 13th worst all-time, which is better than the third worst they posted last season.
We’ll just not talk about the last three games.
Here’s where the Wizards currently rank in the various key stats of team strength (where they ranked at the last update, which was Dec. 11, is in parentheses):
Offensive rating (points allowed per 100 possessions): 27 (28)Defensive rating (points scored per 100 possessions): 29 (29)
The above should not be understood to mean that the Wizards have not played better the past few weeks. They have been better. It does underscore how bad they were before they improved — even much better for nearly a third of the season barely nudges them in the league rankings.
eFG%: 21 (19)Offensive Rebounding Percentage: 20 (24)Turnover Rate: 26 (30)Free Throws Made/Field Goal Attempts: 26 (28)
Since the last update, the Wizards shot about the same and improved in each of the other factors. The most important of these is turnover rate — doing a better job of turning possessions into scoring opportunities.
eFG%: 23 (25)Defensive Rebounding Percentage: 30 (30)Turnover Rate: 28 (29)Free Throws Made/Field Goal Attempts: 15 (14)
The numbers indicate the Wizards have done a better job in the most important factor of NBA defense — making the other team miss. While their defensive rebounding rank didn’t change, the raw number did improve. Previously, they were last by such a wide margin that they could remain last even while getting better.
The Wizards don’t force opponent turnovers. This is partly a reflection of their poor perimeter defense, and partly of their emphasis the past few weeks on trying to limit at-rim attempts.
Player Production Average
Below is a table with updated results from the Player Production Average (PPA) metric so far this season. PPA is an overall rating metric I developed that credits players for things they do that help a team win (scoring, rebounding, play-making, defending) and debits them for things that hurt the cause (missed shots, turnovers, fouls, ineffective defense). PPA is similar to other linear weight rating metrics such as John Hollinger’s PER, David Berri’s Wins Produced, Kevin Pelton’s VORP, and the granddaddy of them all, Dave Heeren’s TENDEX.
PPA weighs a player’s performance per possession against that of his competitors season by season. While PPA falls into the category of a linear weight metric, the values for statistical categories float a bit season-to-season based on league performance.
PPA is pace neutral, accounts for defense, and includes a “degree of difficulty” factor based on the level of competition a player faces while on the floor. Beginning with the 2019-20 season, I added a position/role adjustment designed to reflect how roles and on-court positioning affect individual abilities to produce certain stats.
on-court team defensive ratingpointsrebounds (offensive and defensive weighed differently)assistsstealsblocksshot attemptsturnoverspersonal foulsstartsminutes
In the table below, I’ve included each player’s PPA last time, currently (through games played Jan. 7 — game 36), as well as games played and minutes per game. The Garbage Time Brigade has their own section.
In the table below, LAST = the player’s PPA when I last published an update, which was Jan. 11, 2025.
PLAYERGAMESMPGLASTPPAAlex Sarr2729.7146157Marvin Bagley III3119.398108Justin Champagnie3417.49799Kyshawn George2731.99089Khris Middleton2424.48583Bilal Coulibaly2227.15983Tre Johnson2923.95079Cam Whitmore2116.94949Bub Carrington3627.22347Tristan Vukcevic2711.44643Will Riley2912.63743Malaki Branham209.34442AJ Johnson196.4-28-7DEPARTEDGAMESMPGLASTPPACJ McCollum3530.9115121Corey Kispert1919.58378GTBGAMESMPGPPAPPAAnthony Gill154.44856Jamir Watkins1411.62337Sharife Cooper42.5-66-66Alex Sarr — despite a few bad games during this stretch — significantly improved his PPA score. He’s having a very good season for an NBA player. That he’s doing it at age 20 in his second season is highly encouraging.Marvin Bagley III has given Washington competent play in the middle when Sarr goes to the bench. He’s not the defender Sarr is, but he adds rebounding and provides offensive punch as a roller, finisher, and offensive rebounder. I anticipate the Wizards will trade him to a contending team that needs a good backup big (or possibly even a starter) and would not be shocked to see him return to DC as a free agent in the offseason.Justin Champagnie should be starting.Bilal Coulibaly is healthy and playing better. He played 10 games during this update period, and his full-season PPA went from 59 to 83. He’s still a project on offense, but his process is improving (I’ve written about it in postgame articles) and he’s a very good defender who typically guards the opponents top offensive threat regardless of position.One of the biggest improvers is the 19-year-old Tre Johnson, who’s a lethal shooter adding (unveiling?) offensive repertoire as defenses react. I’d love to see him be more attentive on defense and do some more non-scoring work, but he’s doing great for a teenage rookie.Bub Carrington is another youngster playing better. His PPA poked its nose above the replacement level line in this update — marked improvement from how he played through the teams first couple dozen games.