
The Wizards returned from the All-Star break with disastrous back-to-back wins in a tête-à-tête against the Indiana Pacers. In the one last night, the Wizards rallied from a 15-point second quarter deficit to win by 13.
In the NBA’s 2026 race for the bottom, Washington has fallen to fifth behind the Sacramento Kings, New Orleans Pelicans, Indiana, and the Brooklyn Nets. The Utah Jazz — an annual leader in tanking shenanigans — is lurking.
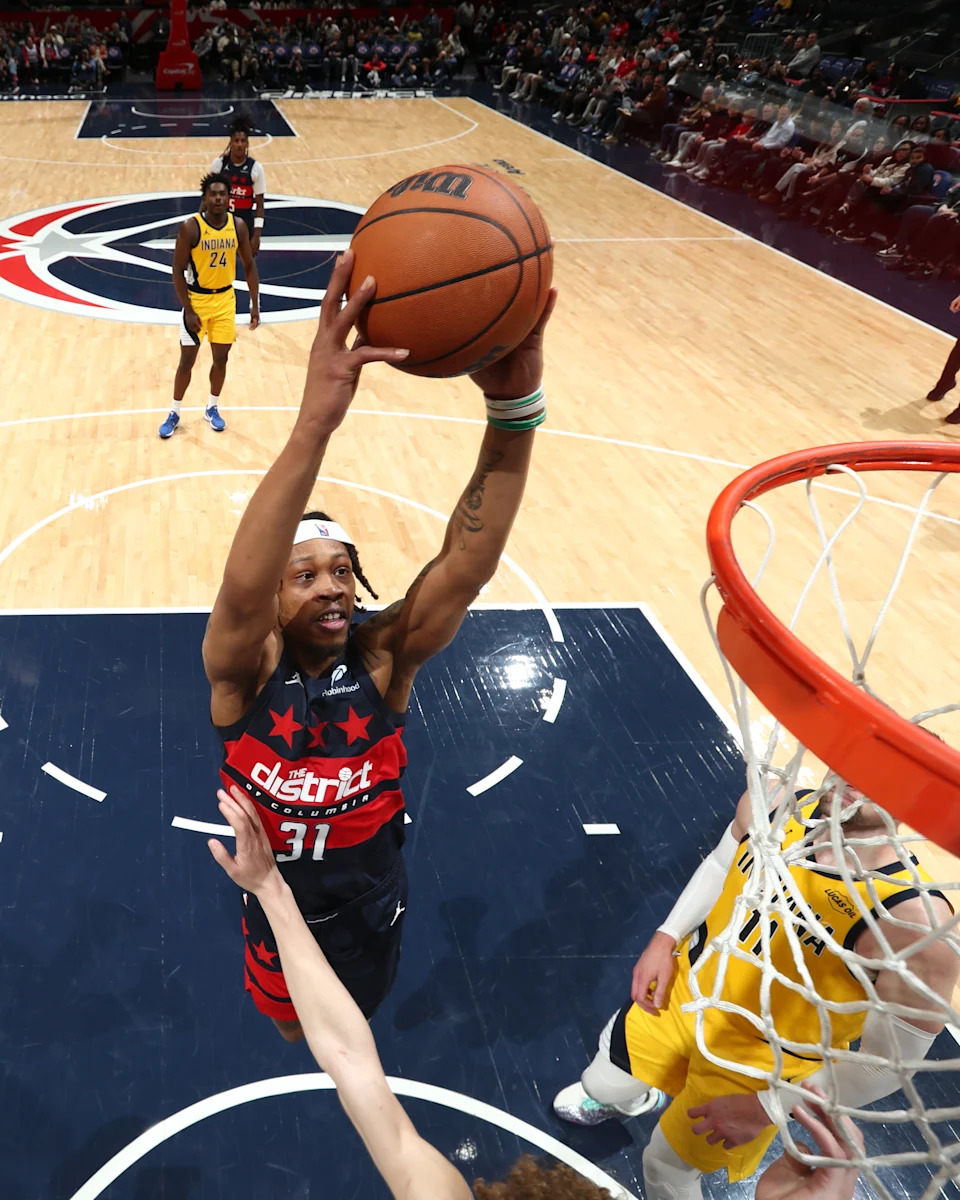
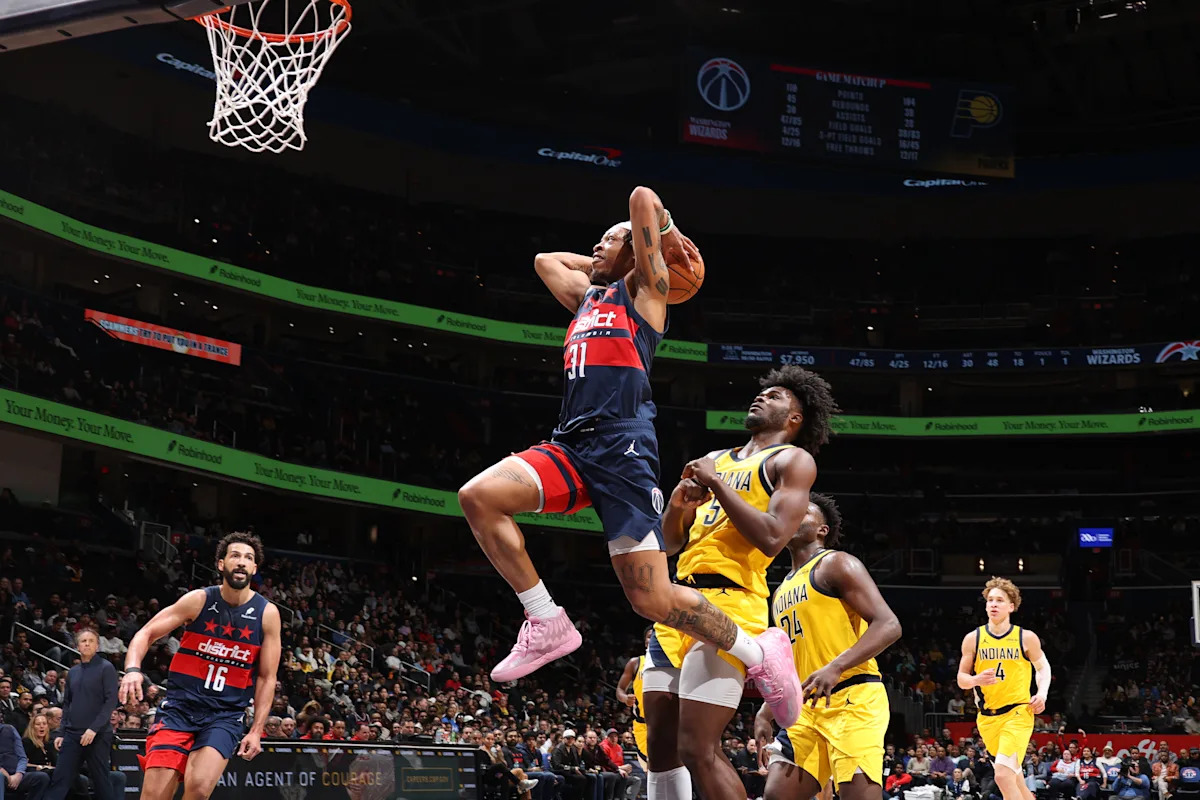
Alondes Williams poured in points during the team’s win over the Indiana Pacers. | NBAE via Getty Images
I sympathize with Wizards head coach Brian Keefe and general manager Will Dawkins. Alex Sarr and Kyshawn George sat. They traded away productive to semi-productive veterans for Anthony Davis and Trae Young — neither of whom has played even a second for the Wizards.
Advertisement
Justin Champagnie, who produces when he plays, departed last night’s game after just 11 minutes with a sore knee.
Keefe is left with no choice but to play kids, and what’s making The Tank a bit of a challenge is that some of those kids are playing pretty well — at least when going up against a Pacers team missing virtually every useful NBA player in the organization.
Kids playing pretty well, even against what amounts to a G League squad, isn’t bad. The Wizards need to lose enough to keep that first round pick, so things could get downright debaculous in the near future. Just to be clear, I want Dawkins to know that I can help. I have enough vacation time to become the NBA’s oldest ever rookie on a 10-day contract. Maybe two.
I mean, yeah my body might not hold up for more than a game or two (if that), but I will brick lots of threes, be easy pickings on defense, and consistently fail to get back on defense.
Advertisement
Also, if Anthony Gill serves as the team dad, I can (briefly) be the team’s granddad.
Thoughts & Observations
Full disclosure: I was on work travel and did not watch either of these games, so these observations are strictly from the numbers.
Amazing to think that the Wizards had a 61.1% effective field goal percentage, and the Pacers clocked in at 57.8% and the teams combined for a slightly subpar offensive night. Both teams committed loads of turnovers. Neither got to the free throw line or gathered offensive rebounds.
If the teams had combined for an average night offensively, they would have totaled 252 points. They tallied 249. Not a huge difference, but again — amazing considering the high shooting percentages from the floor.
Even more amazing: the Wizards shot 61.1% from the floor (eFG%) while also hitting just 6-29 — 20.7% — from three-point range. That’s because they hit 74.2% on twos. Yowza.
Washington’s ability to get inside was determinant — they outscored the Pacers 78-46 in the paint.
Kudos to Alondes Williams for having a great game halfway through a 10-day contract — 25 points, 10 rebounds, 4 assists in 30 minutes.
More kudos to Kadary Richmond, also on a 10-day contract, for producing 6 steals in 31 minutes.
Even more kudos to Sharife Cooper — on a two-way contract — for notching 18 points and 5 assists in 27 minutes.
Yet more kudos to Keefe for giving 55% of the game’s minutes to guys on two-way contracts and 10-day contracts.
Four Factors
Below are the four factors that decide wins and losses in basketball — shooting (efg), rebounding (offensive rebounds), ball handling (turnovers), fouling (free throws made).
The four factors are measured by:
eFG% (effective field goal percentage, which accounts for the three-point shot)
OREB% (offensive rebound percentage)
TOV% (turnover percentage — turnovers divided by possessions)
FTM/FGA (free throws made divided by field goal attempts)
FOUR FACTORS
PACERS
WIZARDS
LGAVG
eFG%
57.8%
61.1%
54.3%
OREB%
19.1%
24.4%
26.1%
TOV%
19.3%
15.6%
12.8%
FTM/FGA
0.156
0.158
0.208
PACE
109
99.4
ORTG
108
120
115.4
Stats & Metrics
PPA is my overall production metric, which credits players for things they do that help a team win (scoring, rebounding, playmaking, defending) and dings them for things that hurt (missed shots, turnovers, bad defense, fouls).
PPA is a per possession metric designed for larger data sets. In small sample sizes, the numbers can get weird. In PPA, 100 is average, higher is better and replacement level is 45. For a single game, replacement level isn’t much use, and I reiterate the caution about small samples sometimes producing weird results.
Advertisement
POSS is the number of possessions each player was on the floor in this game.
ORTG = offensive rating, which is points produced per individual possessions x 100. League average so far this season is listed in the Four Factors table above. Points produced is not the same as points scored. It includes the value of assists and offensive rebounds, as well as sharing credit when receiving an assist.
USG = offensive usage rate. Average is 20%.
ORTG and USG are versions of stats created by former Wizards assistant coach Dean Oliver and modified by me. ORTG is an efficiency measure that accounts for the value of shooting, offensive rebounds, assists and turnovers. USG includes shooting from the floor and free throw line, offensive rebounds, assists and turnovers.
Advertisement
+PTS = “Plus Points” is a measure of the points gained or lost by each player based on their efficiency in this game compared to league average efficiency on the same number of possessions. A player with an offensive rating (points produced per possession x 100) of 100 who uses 20 possessions would produce 20 points. If the league average efficiency is 115, the league — on average — would produced 23.0 points in the same 20 possessions. So, the player in this hypothetical would have a +PTS score of -3.0.
Players are sorted by total production in the game.
WIZARDS
MIN
POSS
ORTG
USG
+PTS
PPA
+/-
Alondes Williams
29
67
184
19.9%
9.2
361
4
Kadary Richmond
31
71
93
11.7%
-1.9
134
3
Anthony Gill
23
53
159
16.0%
3.7
175
8
Tre Johnson
19
42
127
21.4%
1.0
188
3
Tristan Vukcevic
20
46
114
23.5%
-0.1
162
4
Sharife Cooper
27
62
115
24.2%
-0.1
96
2
Will Riley
12
28
134
32.1%
1.7
201
6
Jamir Watkins
23
53
112
17.0%
-0.3
100
12
Bilal Coulibaly
22
50
93
26.3%
-2.9
100
16
Bub Carrington
22
50
90
19.8%
-2.5
82
12
Justin Champagnie
11
24
38
13.6%
-2.6
-45
-5
PACERS
MIN
POSS
ORTG
USG
+PTS
PPA
+/-
Jay Huff
16
36
187
26.9%
6.9
314
12
Micah Potter
26
60
121
22.9%
0.7
124
-16
Kobe Brown
33
76
125
11.4%
0.9
92
-21
Ben Sheppard
20
45
133
14.0%
1.1
126
13
Taelon Peter
37
84
98
13.2%
-1.9
64
-17
Quenton Jackson
23
53
118
31.9%
0.4
100
-14
Jarace Walker
31
70
89
25.0%
-4.7
48
-15
T.J. McConnell
15
33
93
25.6%
-1.9
90
0
Kam Jones
39
88
59
18.9%
-9.3
-25
-7