
The Washington Wizards had a strong defensive effort, holding Miami Heat center Bam Adebayo to 69 points fewer than he scored the last time these teams faced each other.
Editor’s Note: The Wizards allowed more than 150 points for a second straight game and the 15th time in franchise history.
Kevin’s Note: Hey, their defensive rating was six points per 100 possessions better than their last game — they’re IMPROVING!
Yeah, so it wasn’t a strong defensive effort. In fact, it was a downright lousy one, both in terms of mental and physical, and in terms of execution even when their was good effort. In fairness, I don’t know how anyone could be expected to give all-out effort when everyone knows the team really-really-really wants to lose.
In this one, the game was close through the first quarter before the Heat took control in the second period. The avalanche grew throughout the third quarter with Miami’s lead reaching as a high as 35. Bench clearing and classic slacking off contributed to a phony “comeback” in the fourth, which trimmed the final margin to a semi-respectable (looking) 16 points.

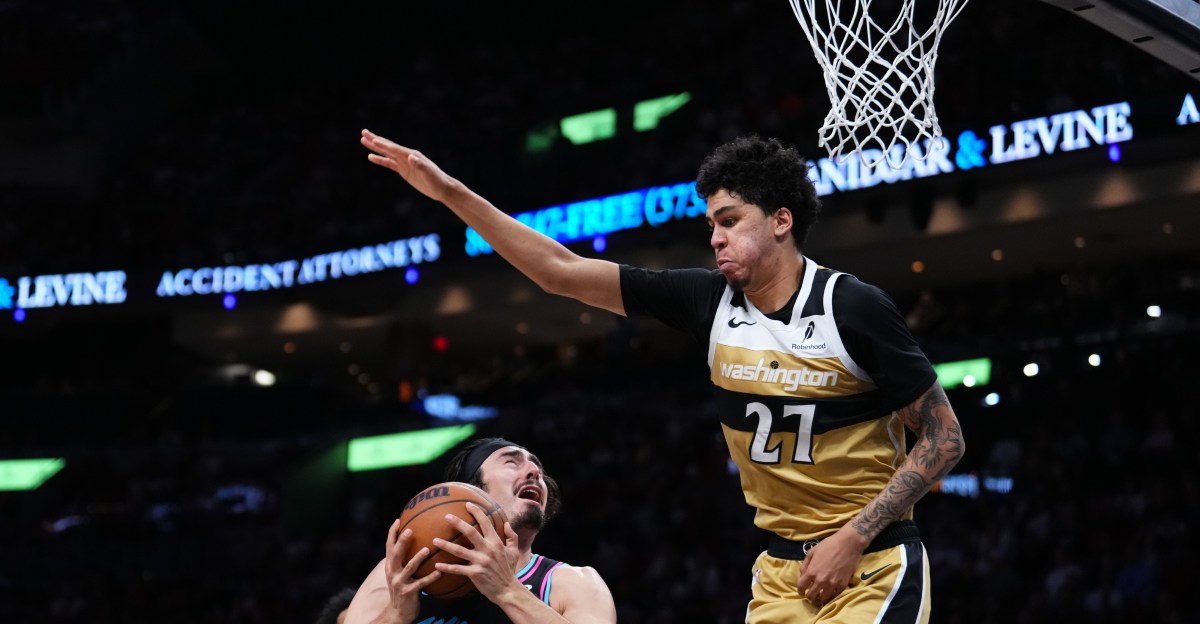
Will Riley dunks during the Washington Wizards loss to the Miami Heat. (Photo by Issac Baldizon/NBAE via Getty Images) NBAE via Getty Images
Another impressive game from Will Riley, who scored 31 points on 12-17 shooting and had 5 steals. He even got a couple buckets using his elongated hesi-dribble. Seriously though, Riley scored in an array of ways, including crafty moves off the bounce to create space, finishing over size, attacking the paint, and hitting catch-and-shoot jumpers.Justin Champagnie had 12 points and 10 rebounds in 21 minutes. He shot 4-9 from the field, which is kinda impressive considering three of those misses were blocks by Heat big Kel’el Ware.JuJu Reese grabbed nine rebounds in 11 minutes of action.Sharife Cooper had 20 points and 7 assists.On the first possession of the game, the Heat went to Bam Adebayo in the post and Washington triple-teamed him — something they didn’t do until the fourth quarter of that 83-point night Adebayo had a few weeks ago.A question I jotted several times throughout the watch was why the Wizards kept trying to attack Bam Adebayo and Davion Mitchell in iso situations. These are two of the NBA’s best defenders in those situations, and the Wizards players are not exactly accomplished one-on-one experts. I mean, Mitchell’s nickname is “Off-Night” for a reason. Pick your spots, guys.Check out the possession at 6:45 of the first quarter for a demonstration of Riley’s skill and craft. This was the play where he caught the ball in the corner against an aggressive ball-denial effort and went instantly into a spin into a dribble drive that got him a layup. I liked the decisiveness — just an instantaneous attack that left no time for a help defender to get there.I remain not a fan of Washington’s penchant for whoever brings the ball up the floor going straight into a jumper after zero passes and running no actions. In transition or a trailing situation, a catch-and-shoot three is a great shot. Maybe this gives me “Old Man Yells At Cloud” status, but in a halfcourt setting against a defense that’s back and matched up, I’d prefer they run something instead of launching immediately.Plays like the one at 4:43 of the second quarter are why I still have hope that Bilal Coulibaly can become something special in the relatively near future. On that play, he drove left on Adebayo and got to a soaring lefty finish. It was an impressive play.I very much liked the set piece Washington ran to start the second half. Anthony Gill set a pindown for Riley. Bub Carrington then made an “entry” pass to Gill, who followed Riley to the top — kind of a very high horns set — for a “get” action (Carrington followed his pass) dribble hand-off. Because Gill received the “entry” so high, Miami’s Mitchell had to go under the screen, and Carrington was left with a wide open three.
Below are the four factors that decide wins and losses in basketball — shooting (efg), rebounding (offensive rebounds), ball handling (turnovers), fouling (free throws made).
The four factors are measured by:
eFG% (effective field goal percentage, which accounts for the three-point shot)OREB% (offensive rebound percentage)TOV% (turnover percentage — turnovers divided by possessions)FTM/FGA (free throws made divided by field goal attempts)FOUR FACTORSWIZARDSHEATLGAVGeFG%55.2%67.2%54.5%OREB%30.4%27.0%26.0%TOV%8.3%12.9%12.7%FTM/FGA0.1790.2900.207PACE10899.3ORTG125140115.7
PPA is my overall production metric, which credits players for things they do that help a team win (scoring, rebounding, playmaking, defending) and dings them for things that hurt (missed shots, turnovers, bad defense, fouls).
PPA is a per possession metric designed for larger data sets. In small sample sizes, the numbers can get weird. In PPA, 100 is average, higher is better and replacement level is 45. For a single game, replacement level isn’t much use, and I reiterate the caution about small samples sometimes producing weird results.
POSS is the number of possessions each player was on the floor in this game.
ORTG = offensive rating, which is points produced per individual possessions x 100. League average so far this season is listed in the Four Factors table above. Points produced is not the same as points scored. It includes the value of assists and offensive rebounds, as well as sharing credit when receiving an assist.
USG = offensive usage rate. Average is 20%. Median so far this season is 17.7%.
ORTG and USG are versions of stats created by former Wizards assistant coach Dean Oliver and modified by me. ORTG is an efficiency measure that accounts for the value of shooting, offensive rebounds, assists and turnovers. USG includes shooting from the floor and free throw line, offensive rebounds, assists and turnovers.
+PTS = “Plus Points” is a measure of the points gained or lost by each player based on their efficiency in this game compared to league average efficiency on the same number of possessions. A player with an offensive rating (points produced per possession x 100) of 100 who uses 20 possessions would produce 20 points. If the league average efficiency is 115, the league — on average — would produced 23.0 points in the same 20 possessions. So, the player in this hypothetical would have a +PTS score of -3.0.
Players are sorted by total production in the game.
WIZARDSMINPOSSORTGUSG+PTSPPA+/-Will Riley378316618.3%7.7203-3Sharife Cooper255714526.3%4.31526Justin Champagnie214615121.3%3.5182-12Jamir Watkins194317216.9%4.014313Jaden Hardy255611624.0%0.11013Bilal Coulibaly25579521.1%-2.477-20Julian Reese102412712.4%0.31355Anthony Gill225014712.1%1.960-23Bub Carrington27618721.6%-3.831-25Tre Johnson25578621.9%-3.7-20-17Leaky Black41007.4%-0.8-127-7HEATMINPOSSORTGUSG+PTSPPA+/-Kel’el Ware368115617.7%5.72117Jaime Jaquez Jr.327214826.1%6.21951Andrew Wiggins265916520.0%5.818924Bam Adebayo245514920.1%3.616625Davion Mitchell265814415.9%2.613819Pelle Larsson245411526.0%-0.111227Kasparas Jakucionis286312022.6%0.691-2Simone Fontecchio194317411.3%2.813212Dru Smith122711917.2%0.2135-15Keshad Johnson1125118.0%0.35551Nikola Jovic132910316.5%-0.619-19