
I sure hope Adam Silver and whatever blue ribbon panel he assembles to end the practice of tanking succeeds because watching the end of this Wizards season just plain sucks. Last night, the G-League-plus lineup and some playing time shenanigans got Washington a 31-point vanquishing by a Bulls team that entered the game with a 5-22 record since the trade deadline.
This one wasn’t close. Or competitive. Or even entertaining. There was some spectacle in the sense that both teams played fast. The way that played out was the Bulls ran for layups and transition threes, and the Wizards took quick shots…which the Bulls then turned into fastbreak layups. For the game, the Bulls outscored Washington 31-14 in transition points.
The big reason the final margin wasn’t even bigger? Chicago is terrible. Against a Wizards team giving up wide-open threes and frequent free runs at the rim, the Bulls made just a third of their threes.
At the game’s pace, league average efficiency would have produced a combined 248 points. The Wizards and Bulls managed 227. Much of the credit for that belongs to Washington’s offense, which registered an offensive rating of 91. League average this season: 115.7.
Washington’s defense was so non-competitive that Patrick Williams (who’s a well below average NBA player) and Rob Dillingham (whose first team gave up on) had probably the best games of their NBA careers. Williams had 20 points, 7 rebounds, 6 assists, 3 steals and a block — the kind of performance the Bulls imagined they would get when they signed him to a five-year, $90 million contract. Dillingham scored 26 points in 27 minutes.
As bad as it was, the game was not completely devoid of positives for the Wizards — at least as far as we can extract anything meaningful from an opponent as similarly lacking in true NBA-level talent.
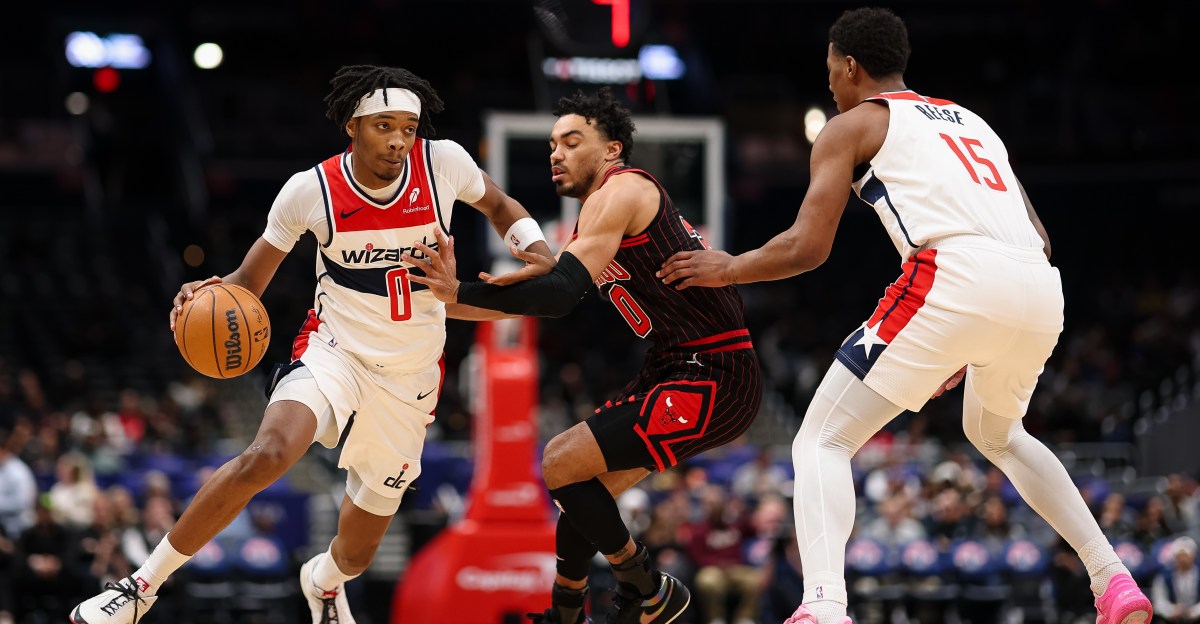
Bilal Coulibaly continued to attack with dribble drives. Opponents have had trouble staying in front of him when he decides drive, and the Bulls were no different. Chicago’s zone help concepts frequently brought what passes for their big man into his driving lane, but Coulibaly was able to get into effective pull-ups or kick to open teammates…who missed the open looks.JuJu Reese had another double-double — 17 points, 11 rebounds. During the broadcast, Glenn Consor said Reese has shown he’s an NBA player. I still think that’s a bit optimistic — his big rebounding numbers have mostly come against lineups lacking size. I kinda think he’s in that four-A situation they used to talk about when I followed baseball. Basically, it was a label applied to players who could excel at the AAA level but weren’t quite good enough to be productive at the highest level. Maybe Reese can get there if he works on body and skills.
Below are the four factors that decide wins and losses in basketball — shooting (efg), rebounding (offensive rebounds), ball handling (turnovers), fouling (free throws made).
The four factors are measured by:
eFG% (effective field goal percentage, which accounts for the three-point shot)OREB% (offensive rebound percentage)TOV% (turnover percentage — turnovers divided by possessions)FTM/FGA (free throws made divided by field goal attempts)FOUR FACTORSBULLSWIZARDSLGAVGeFG%56.9%49.4%54.5%OREB%19.1%15.7%26.0%TOV%12.1%19.6%12.7%FTM/FGA0.2340.1510.207PACE10799.3ORTG12091115.7
PPA is my overall production metric, which credits players for things they do that help a team win (scoring, rebounding, playmaking, defending) and dings them for things that hurt (missed shots, turnovers, bad defense, fouls).
PPA is a per possession metric designed for larger data sets. In small sample sizes, the numbers can get weird. In PPA, 100 is average, higher is better and replacement level is 45. For a single game, replacement level isn’t much use, and I reiterate the caution about small samples sometimes producing weird results.
POSS is the number of possessions each player was on the floor in this game.
ORTG = offensive rating, which is points produced per individual possessions x 100. League average so far this season is listed in the Four Factors table above. Points produced is not the same as points scored. It includes the value of assists and offensive rebounds, as well as sharing credit when receiving an assist.
USG = offensive usage rate. Average is 20%. Median so far this season is 17.7%.
ORTG and USG are versions of stats created by former Wizards assistant coach Dean Oliver and modified by me. ORTG is an efficiency measure that accounts for the value of shooting, offensive rebounds, assists and turnovers. USG includes shooting from the floor and free throw line, offensive rebounds, assists and turnovers.
+PTS = “Plus Points” is a measure of the points gained or lost by each player based on their efficiency in this game compared to league average efficiency on the same number of possessions. A player with an offensive rating (points produced per possession x 100) of 100 who uses 20 possessions would produce 20 points. If the league average efficiency is 115, the league — on average — would produced 23.0 points in the same 20 possessions. So, the player in this hypothetical would have a +PTS score of -3.0.
Players are sorted by total production in the game.
WIZARDSMINPOSSORTGUSG+PTSPPA+/-Bilal Coulibaly245313722.9%2.6178-22Julian Reese36819824.0%-3.4101-15Sharife Cooper276110625.6%-1.564-22Anthony Gill163515211.7%1.5100-13Jamir Watkins224910125.1%-1.869-4Bub Carrington32719124.6%-4.431-20Justin Champagnie29656513.6%-4.522-14Leaky Black2454567.8%-2.5-31-31Will Riley31692619.0%-11.7-90-14BULLSMINPOSSORTGUSG+PTSPPA+/-Patrick Williams327115917.3%5.431025Rob Dillingham276112229.0%1.123924Tre Jones276012529.5%1.722815Collin Sexton30689729.0%-3.715121Isaac Okoro163615018.3%2.326815Lachlan Olbrich214711316.0%-0.215217Leonard Miller255611017.6%-0.611620Yuki Kawamura16371735.5%1.11176Mac McClung184112311.1%0.368-2Guerschon Yabusele27609215.3%-2.12414