
As we hit summer, the Spartans are gearing up for the 2025 season and we’re pondering whether to have that frozen custard as a sundae or a shake… you know since we did that big workout earlier. History and stats give us clear markers of what’s required to compete and win in today’s Big Ten football landscape (sure, less hot fudge, more protein – go with that). Looking back at Michigan State’s more successful recent campaigns and their top performers, a few performance thresholds emerge on offense.
Rushing: The Power of Efficiency
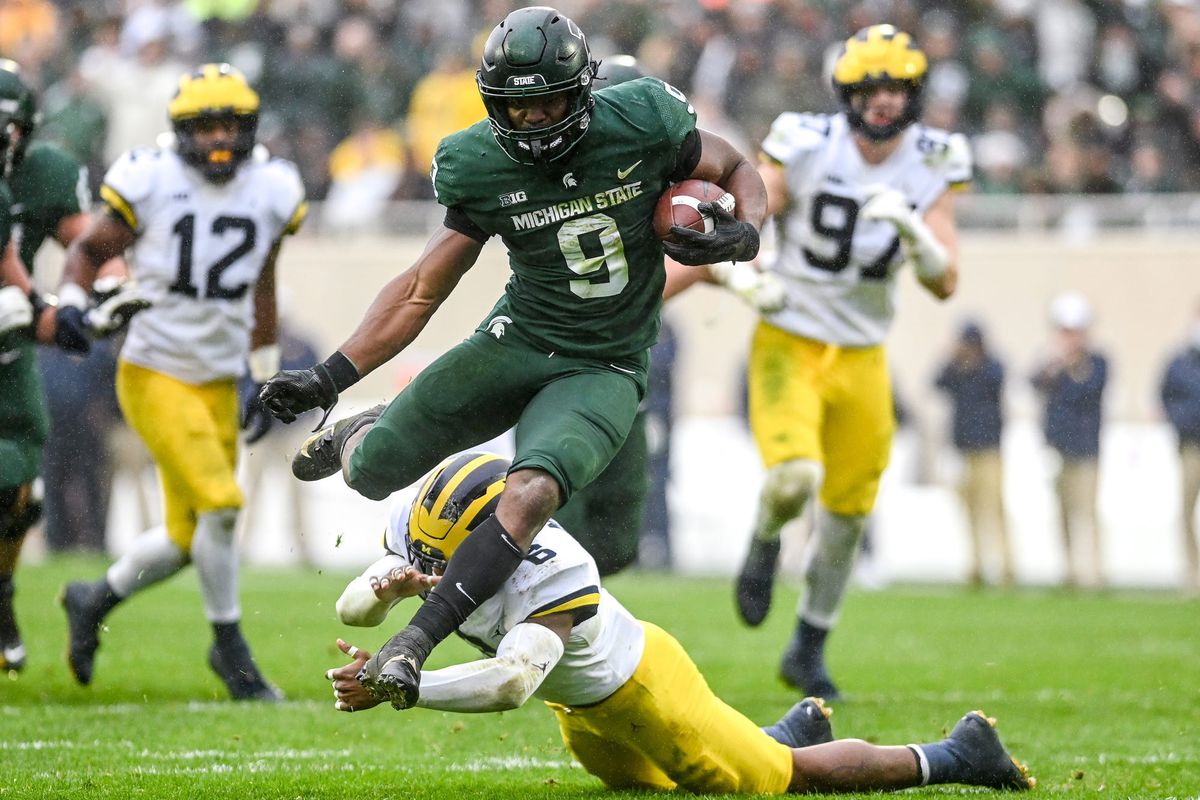
Nick King/USA TODAY NETWORK / USA TODAY NETWORK
Michigan State’s best seasons have featured running backs who consistently averaged well above 4.7 yards per carry. K-9 (a.k.a. Kenneth Walker III), averaged 6.2 YPC during his 2021 campaign is a given/anomaly. Though look at Javon Ringer’s 5.2 YPC across 2007-2008. Even solid contributors like Jeremy Langford (5.1 YPC) and Le’Veon Bell (5.0 YPC) helped fuel seasons where MSU went 11–2 or better (2010-2015, minus the 7-6 season for 2012).
Actually, a threshold seems clear: A combined rushing average of roughly 4.7 YPC or better correlates strongly with winning records and bowl eligibility. This season, that places pressure on a set of running backs who have mostly not touched the ball yet for MSU – as much as on the offensive line to carry the ground game efficiently and sustain drives. The hog mollys or juice squad, whatever you want to call them, will likely have three, maybe four new names on jerseys to watch. That said, the pieces like Stanton Ramil and Big Dooley are legit. In combo, are the front 5 pushing close to 5 yards per carry legit? Maybe, if there’s some solid QB play keeping the defense guessing.
Running Backs
#
Player
Years
Att
Rush Avg
Scrimmage Yds
Rush TDs
#
Player
Years
Att
Rush Avg
Scrimmage Yds
Rush TDs
1
Kenneth Walker III
2021
263
6.2
1,725
18
2
Javon Ringer
2007–2008*
843
5.2
5,117
34
3
Jeremy Langford
2011–2014
577
5.1
3,186
40
4
Le’Veon Bell
2010–2012
671
5.0
3,877
33
5
Nick Hill
2010–2014
225
5.0
1,199
11
6
Kay’ron Adams
2024
133
4.9
734
2
7
LJ Scott
2015–2018
610
4.7
3,258
25
8
Jalen Berger
2022–2023
173
4.5
944
7
9
Nate Carter
2023–2024
301
4.3
1,573
9
10
Elijah Collins
2018–2022
353
4.3
1,766
11
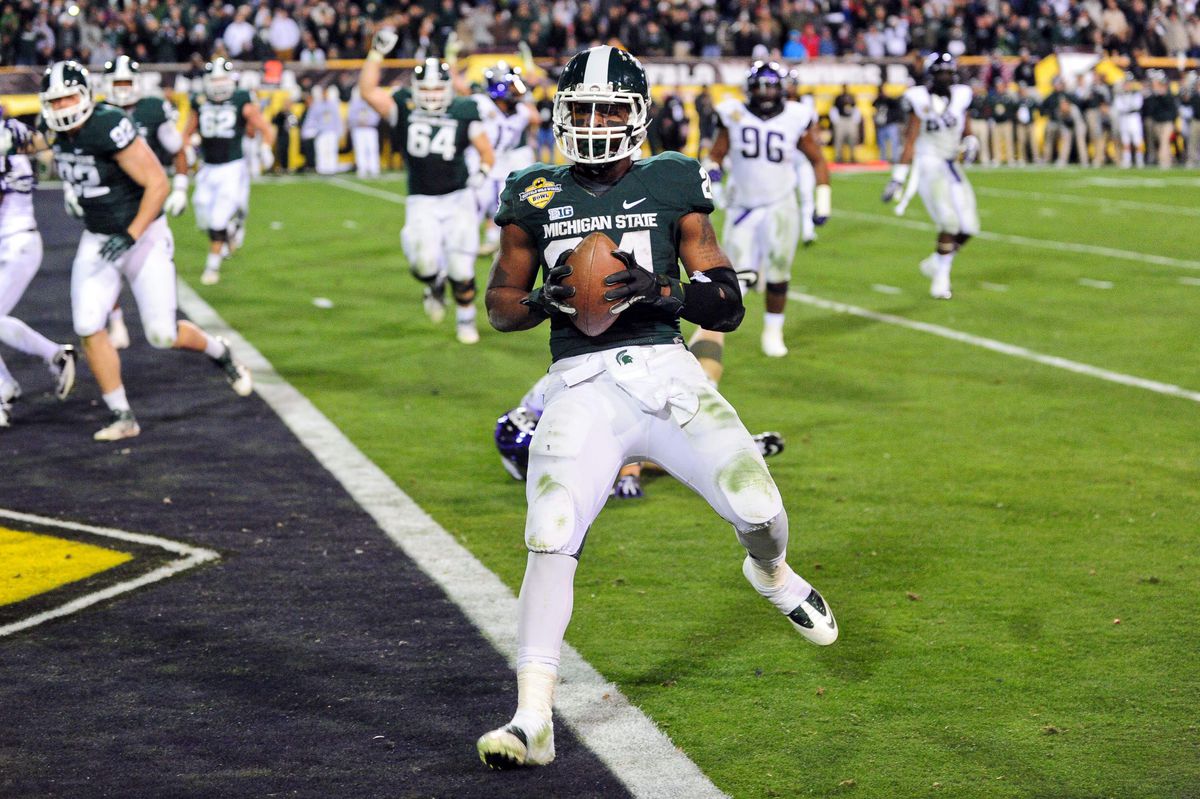
Matt Kartozian-Imagn Images
Passing: Making Every Attempt Count
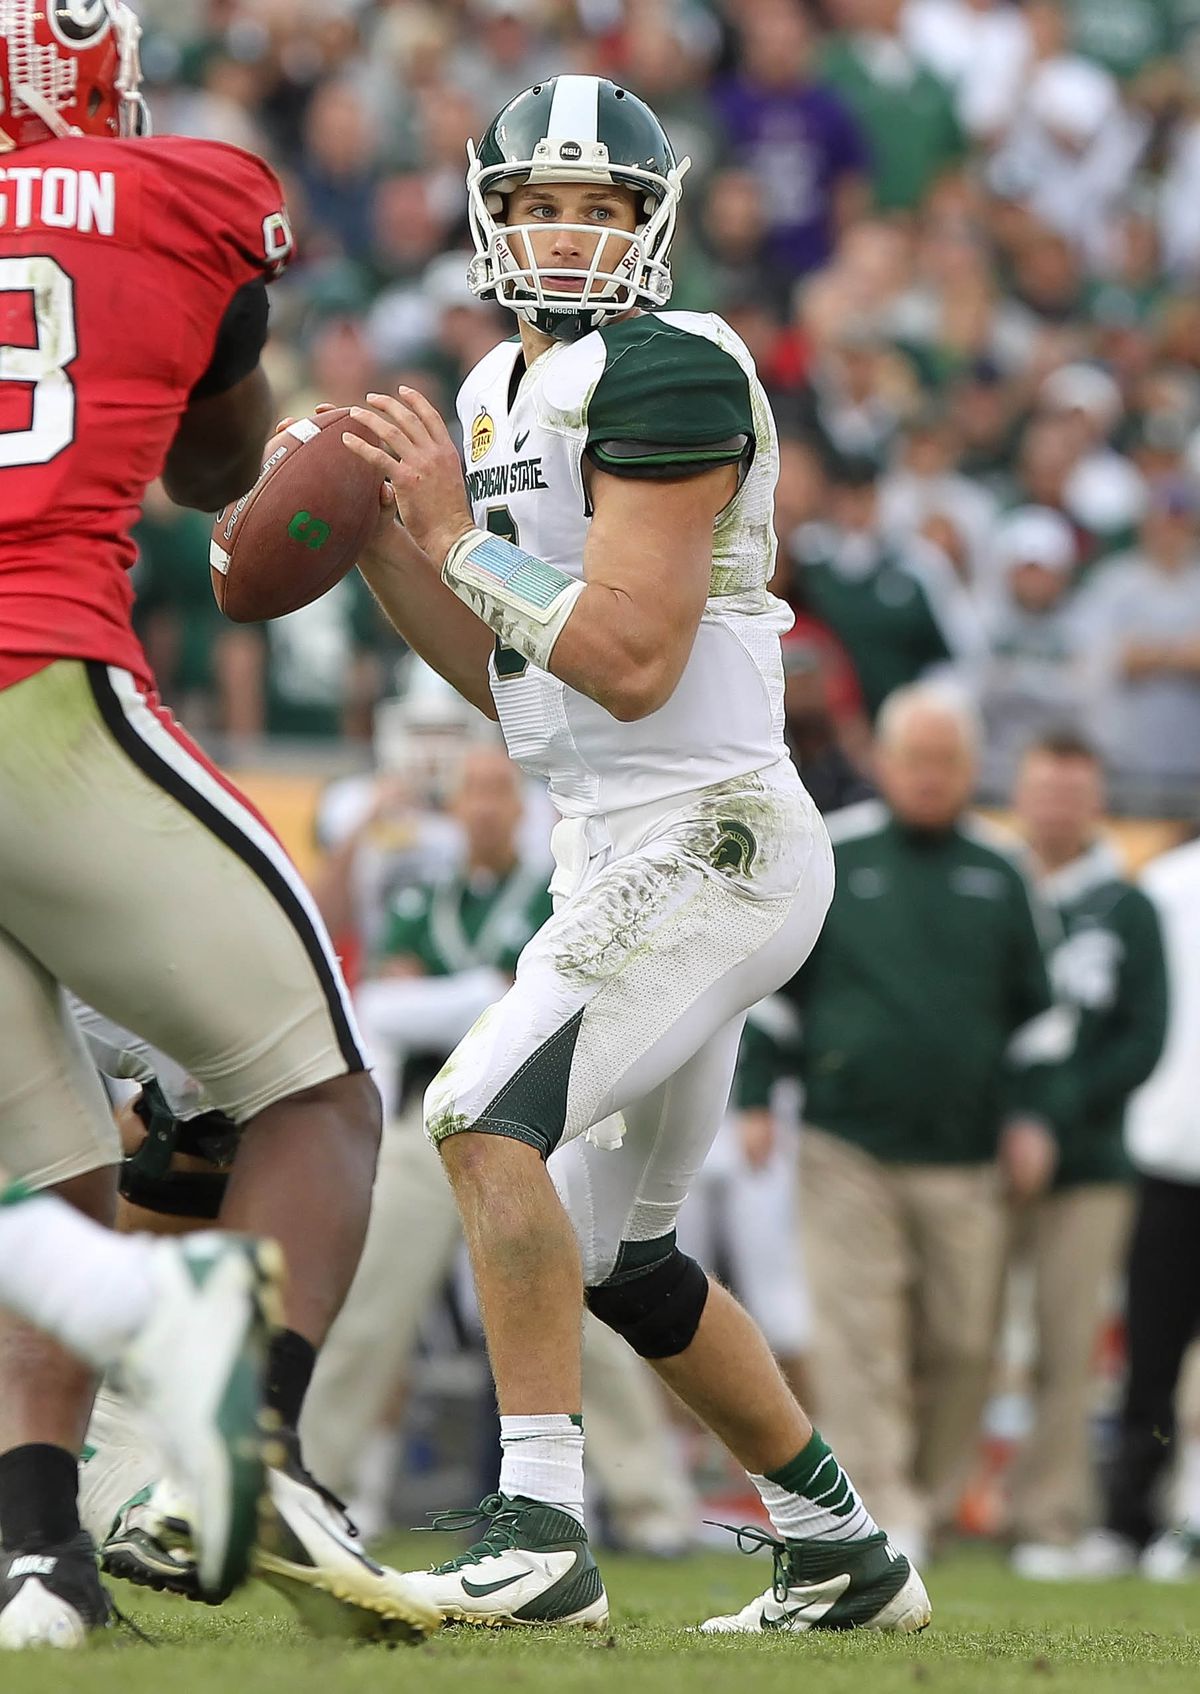
Good Quarterback play to keep balance in the attack definitely seemed to work a decade and change ago. The Spartans’ peak seasons often featured QBs averaging close to 8 yards per attempt or better. Kirk Cousins (8.1) and Connor Cook (7.9) led the charge in the most successful Dantonio days. More recently, Payton Thorne hovered in the 7.6-ish yards per attempt range, maintaining high completion percentages and QB ratings above 130 (even if some of you didn’t feel he had the winning instinct and only got to pad his stats because of Walker).
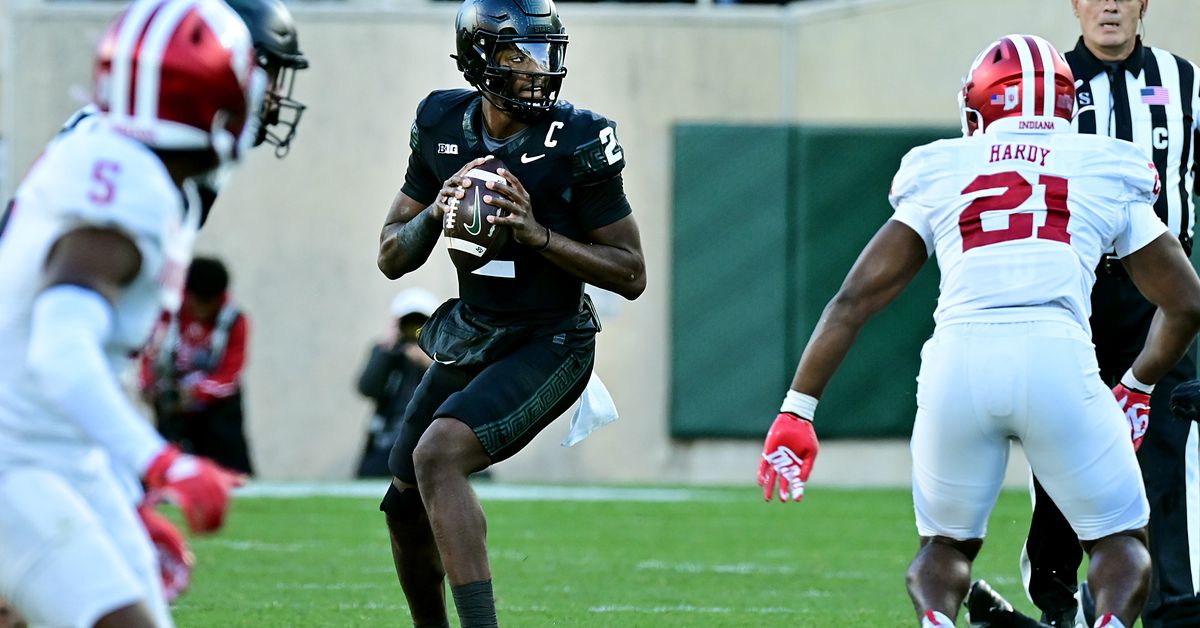
Kim Klement-Imagn Images
The challenge this year falls heavily on Aidan Chiles, who boasts a respectable 7.5 Y/A but obviously needs to quicken his decision-making and correspondingly calm a few throws to boost his QB rating above last season’s 128.7. That should translate to reduced interceptions and improving completion percentage into the 60’s. Basically, if we’re seeing mid-130’s in his rating and even a slight boost in his yard averages the team is suddenly contending in a way most people would be skeptical of in year 2 of the new program. 7.8 and 137 with a 60%+ completion percentage aren’t out of the question and seem to be a threshold for upper tier success. A regression isn’t automatic loss, but it likely would mean there’s a lot of pieces not quite in place yet.
Quarterbacks
#
Player
Years
Att
Y/A
Cmp%
Rating
TDs
#
Player
Years
Att
Y/A
Cmp%
Rating
TDs
1
Kirk Cousins*
2008–2011
1128
8.1
64.1%
146.1
66
2
Connor Cook*
2012–2015
1170
7.9
57.5%
139.8
71
3
Payton Thorne
2020–2022
860
7.6
60.9%
137.6
49
4
Aidan Chiles
2024
323
7.5
59.4%
128.7
13
5
Tyler O’Connor*
2013–2016
316
7.4
59.5%
135.7
20
6
Noah Kim
2022–2023
179
7.1
58.7%
127.9
9
7
Brian Hoyer
2005–2008
896
6.9
55.8%
121.3
35
8
Katin Houser
2022–2023
193
5.9
58.5%
112.9
6
9
Brian Lewerke
2016–2019
1249
6.6
57.7%
120.8
47
10
Andrew Maxwell*
2010–2013
530
5.7
52.5%
105.5
14
11
Rocky Lombardi*
2018–2020
332
5.7
47.9%
98.5
11
As mentioned, running backs are a complete unknown – and the O-line’s ability to gel and keep ball handlers untouched and upright well into + territory is yet to be seen. We’re optimistic.
Poll
Do you think Aiden Chiles will hit the mentioned thresholds
52%
Yes – All Three
(9 votes)
5%
Completion % and one other
(1 vote)
11%
Nah, he’ll be scrambling for his life
(2 votes)
17 votes total
Poll
Will the Offense be able to generate a 4.7 YPC average this season
47%
They’ll get close
(8 votes)
17%
Hell no – if they even manage anything close to last year I’ll be astonished.
(3 votes)
17 votes total
Enjoy your custard… er. protein shake.
Go Green.