
We’ve got a new No. 1 team in DVOA this week as the Detroit Lions move up a spot ahead of the Seattle Seahawks. However, the Seahawks only drop one spot to No. 2 after their loss to Tampa Bay. In fact, you might be surprised by the DVOA rankings because so many teams that lost this week stayed high. The Rams are still fourth, the Chiefs move up to sixth, and the Bills only drop to ninth. The Eagles climb a spot and are now No. 11.
A big reason that for the difference between wins and losses and movement on the DVOA table? We had a remarkable SIX games this week with “reverse PGWE.”
In case you are new to our site, Post-Game Win Expectancy (PGWE) is my formula that helps us figure out if a team outplayed its opponent despite a loss. It accounts for DVOA splits, total plays, and penalties, and then asks “given these underlying statistics, how often would we expect each team to win the game?” A “reverse PGWE” game is one where the “wrong team wins” and here are the six games this week:
Los Angeles Rams 91% (49ers 26, Rams 23): The Rams outgained the 49ers on a per-play basis, and it wasn’t close: 7.1 yards per play to 4.9. In fact, the Rams had more total yards (456 to 407) despite the 49ers running almost 20 more plays. The 49ers also had more penalties. The Rams did fumble twice, but the 49ers recovered both fumbles. The Rams are now fourth in DVOA while the 49ers drop to 16th despite being 4-1.
Seattle Seahawks 82% (Buccaneers 38, Seahawks 35): The Seahawks had more total yards (463 to 426) and more yards per play (8.6 vs. 7.3) compared to the Buccaneers. They did turn the ball over twice, where the Bucs had no turnovers, and Jason Myers missed a 44-yard field goal wide left. The Seahawks lost despite converting 6-of-9 third downs and their only try on fourth downs. As noted above, the Seahawks are second in DVOA. They’re also second all-time among 3-2 teams.
As I noted on Threads:
The Buccaneers are 18th in DVOA with one of the lowest DVOA ratings for any 4-1 team ever, which is something Bryan Knowles will be writing more about Wednesday.
Arizona Cardinals 80% (Titans 22, Cardinals 21): You know this one. Emari Demercado fumbled right before he ran into the end zone, and the Cardinals lost the ball instead of getting a touchdown. Cam Ward throws an interception, the Cardinals drop the ball, and the Titans recover in the end zone for a touchdown after it gets kicked around a bit. The Cardinals outgained the Titans, 5.6 yards per play to 5.0 yards per play. They’ve lost three straight games by a total of five points. Arizona is now 19th in DVOA while the Titans go up two spots from last place to 30th.
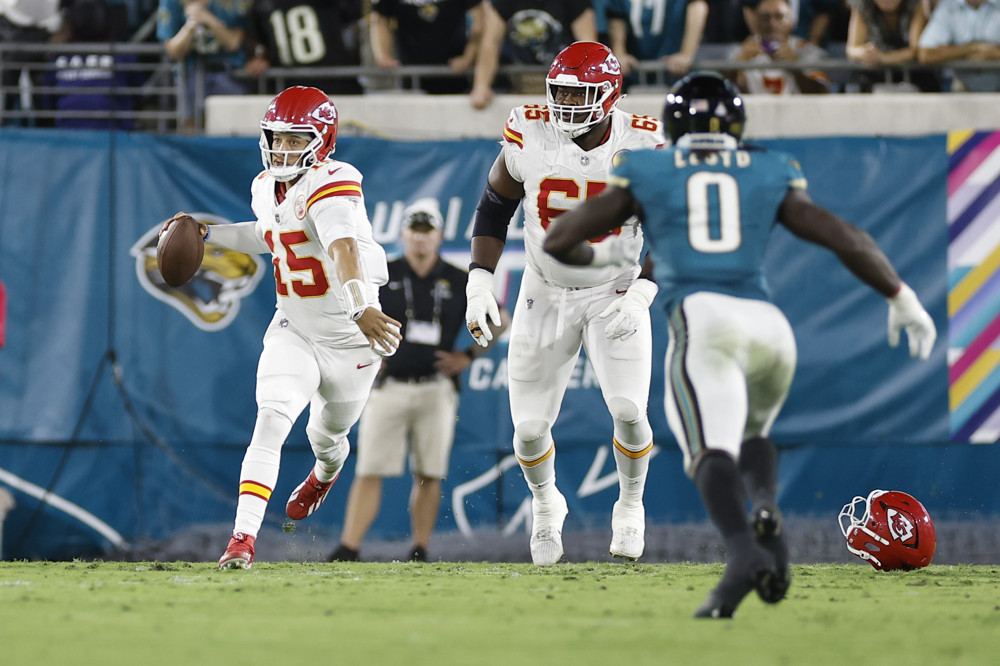
Kansas City Chiefs 78% (Jaguars 31, Chiefs 28): This is what happens when you throw a pick-six on the 1-yard line, one of the greatest reversals of Expected Points Added possible. DVOA only considers interceptions based on the average return given the line of scrimmage and the distance of the pass; the actual return itself is considered to be random. Whether a Kansas City offensive player is able to tackle Devin Lloyd doesn’t really tell us about the Chiefs’ ability to move the ball on offense in the future. The Chiefs outgained the Jaguars 476 yards to 319 yards in total. The Chiefs move up to sixth in DVOA this week and the Jaguars drop to 12th despite the win.
Philadelphia Eagles 71% (Broncos 21, Eagles 17): Another game where the winning team had fewer yards per play (5.5 to 5.1) and more penalties (12 to 9, including declined and offsetting). There were no turnovers in the game by either team. Part of the Eagles’ problem was that they only converted twice on 11 third-down attempts. The Broncos move down a spot to 10th in DVOA while the Eagles move up one spot to 11th.
Buffalo Bills 58% (Patriots 23, Bills 20): This one is very close by the standard stats. Both teams gained 6.0 yards per play and the Bills had more penalties than the Patriots. However, the Bills did have better passing DVOA (which matters more than rushing) and better special teams performance, despite Andy Borregales hitting the 52-yard field goal that won the game. The Bills did drop three spots to ninth in DVOA, and the Patriots drop a spot to 21st (but are basically tied with Minnesota for 20th).
* * * * *
These are the FTN DVOA and DAVE ratings through five weeks of 2025. Our Defense-adjusted Value Over Average (DVOA) system breaks down every single play and compares a team’s performance to the league average based on situation in order to determine value over average. (Explained further here.) Opponent adjustments are currently at 50% of their final strength.
OFFENSE and DEFENSE DVOA are adjusted for performance indoors and consider all fumbles, kept or lost, as equal value. SPECIAL TEAMS DVOA is adjusted for type of stadium (warm, cold, dome, Denver) and week of season. As always, positive numbers represent more points so DEFENSE is better when it is NEGATIVE.
DAVE is a formula which combines our preseason forecast with current DVOA to get a more accurate projection of how a team will play the rest of the season. For teams with four games, DAVE is currently 59% preseason forecast for offense and 84% preseason forecast for defense and special teams. For teams with five games, DAVE is currently 50% preseason forecast for offense and 77% preseason forecast for defense and special teams.
Due to a technical issue, this week’s Giants-Saints game is missing from DVOA, we should have that fixed by next week.
RK
TEAM
TOTAL
DVOA
LAST
WEEK
TOTAL
DAVE
RK
W-L
OFF.
DVOA
OFF.
RK
DEF.
DVOA
DEF.
RK
S.T.
DVOA
S.T.
RK
1
DET
45.5%
2
27.9%
1
4-1
22.1%
4
-16.9%
2
6.5%
4
2
SEA
42.2%
1
15.0%
6
3-2
22.2%
3
-9.6%
7
10.4%
1
3
IND
37.1%
4
6.6%
11
4-1
23.5%
2
-11.6%
5
2.0%
13
4
LAR
34.9%
3
18.5%
4
3-2
27.1%
1
-7.1%
11
0.8%
17
5
WAS
31.6%
5
17.8%
5
3-2
13.6%
8
-7.7%
10
10.3%
2
6
KC
21.0%
8
19.0%
3
2-3
18.1%
7
-3.4%
15
-0.4%
21
7
GB
18.8%
11
11.5%
8
2-1-1
6.6%
11
-16.8%
3
-4.5%
25
8
HOU
17.6%
17
5.3%
12
2-3
-0.7%
17
-13.8%
4
4.6%
6
9
BUF
14.8%
6
19.4%
2
4-1
19.0%
6
3.6%
22
-0.6%
22
10
DEN
11.4%
9
8.3%
9
3-2
4.9%
12
-4.0%
14
2.5%
12
11
PHI
11.2%
12
12.1%
7
4-1
3.4%
14
-8.5%
9
-0.7%
23
12
JAX
9.3%
7
3.2%
15
4-1
3.0%
15
-3.0%
16
3.3%
9
13
ATL
4.6%
16
-4.5%
22
2-2
-5.4%
21
-17.8%
1
-7.8%
27
14
PIT
4.3%
13
-1.5%
18
3-1
-1.8%
18
-6.2%
12
-0.2%
19
15
DAL
3.1%
22
3.3%
14
2-2-1
19.0%
5
19.8%
31
3.8%
8
16
SF
-1.6%
15
4.2%
13
4-1
6.9%
10
-2.2%
18
-10.7%
30
RK
TEAM
TOTAL
DVOA
LAST
WEEK
TOTAL
DAVE
RK
W-L
OFF.
DVOA
OFF.
RK
DEF.
DVOA
DEF.
RK
S.T.
DVOA
S.T.
RK
17
LAC
-1.8%
10
0.1%
17
3-2
-3.4%
19
-2.8%
17
-1.2%
24
18
TB
-3.4%
18
3.0%
16
4-1
9.0%
9
1.6%
20
-10.8%
31
19
ARI
-5.7%
19
-3.3%
19
2-3
-14.3%
25
-8.9%
8
-0.3%
20
20
MIN
-6.0%
21
-3.6%
20
3-2
-14.9%
27
-5.8%
13
3.0%
10
21
NE
-6.0%
20
-3.9%
21
3-2
4.7%
13
12.4%
27
1.7%
15
22
BAL
-9.2%
14
7.4%
10
1-4
1.2%
16
11.6%
26
1.2%
16
23
CHI
-15.2%
24
-5.0%
23
2-2
-12.4%
23
4.7%
23
1.9%
14
24
CAR
-21.9%
29
-22.5%
31
2-3
-14.7%
26
1.3%
19
-5.9%
26
25
CLE
-22.1%
27
-17.1%
28
1-4
-24.1%
30
-10.3%
6
-8.3%
28
26
NYG
-22.1%
28
-15.5%
26
1-4
-18.0%
28
8.3%
24
4.2%
7
27
MIA
-22.2%
25
-12.2%
24
1-4
-3.6%
20
26.0%
32
7.4%
3
28
NYJ
-23.5%
23
-16.4%
27
0-5
-14.1%
24
15.0%
28
5.6%
5
29
LV
-33.6%
26
-13.8%
25
1-4
-19.6%
29
3.4%
21
-10.6%
29
30
TEN
-37.7%
32
-27.0%
32
1-4
-29.1%
32
11.5%
25
2.9%
11
31
NO
-41.7%
31
-18.7%
29
1-4
-11.9%
22
16.0%
29
-13.8%
32
32
CIN
-44.1%
30
-21.3%
30
2-3
-28.3%
31
16.3%
30
0.5%
18