
Believe it or not, the Seattle Kraken are through approximately 20 percent of their schedule already. By raw standings points, the Kraken are just barely outside the playoff picture, with 19 points through 16 games. By points percentage, the Kraken are barely in, fractionally ahead of several other teams. However you slice it, every game and point matters, and most Kraken fans are (and should be) watching Kraken hockey with winning in mind.
Thus, inquiring minds likely want to know if the Kraken’s early-season performance is a harbinger of a playoff contender or just a mirage? Have individual players elevated? Can we point to specific areas of strength? Or are there are worrying trends or trouble spots? All of these questions circle the core issue: Is Seattle’s early-season success sustainable?
Team success is a nuanced issue that depends on many factors that cannot be quantified, particularly over such a limited sample. In a sport dependent on effort level and buy-in spanning a lengthy physical grind, I tend to believe early-season results have a positive feedback effect independent of skill level or scheme. When you add in a staff that demands structure, monitors the details, and makes adjustments, there is ample reason for optimism.
Team and player-level data can provide us a bit more context and trigger further thought and inquiry in addressing any of the questions above. That is the goal of today’s exercise, rather than a deep dive into any particular area. Any one chart below could be an entire article.
A caveat and a limitation on using early-season numbers
The sample size we’re dealing with is small. Some recent research from Neil Pierre-Louis suggests 400 shot attempt events (which equates to approximately 15 games) is around the area where the reliability and predictability of basic public shot data gets close to its zenith. (That is, it’s never perfectly predictive; far from it. But it doesn’t get much better with bigger samples.) 16 games into the Kraken season, we’re in that neighborhood at the team level.
On the other hand, obviously, the player-level data is more limited. This is important to keep in mind when considering Player X’s on-ice shot quality impacts, for example. There’s still a good deal of noise to be sorted through. Analytics outfits like Evolving Hockey tend to publish their player models only after accruing 15 to 20 games worth of data, so it’s not unfairly early to start looking at these individual numbers. We just need to guard against sweeping conclusions.
That said, there is one area where I do think it is too early for the data to illuminate conversation: Special teams. After 10 games, we discussed on the Sound Of Hockey Podcast how the Kraken were by several metrics the worst-performing penalty-kill unit in the league while also being one of the best teams (if not the best team) at suppressing opponent shot quality. Since that time, both figures have moved closer to the middle of the spectrum.
Given the sample sizes involved, I omitted penalty-kill and power-play numbers from this snapshot. For now, it’s likely enough to say that there is room to be encouraged by improvements on special teams. Let’s put a pin in that.
Ok, with all of that out of the way, let’s dive in. All data was collected the morning of Nov. 12, 2025, so it does not include any games since that time. Unless otherwise noted below, the data is from Natural Stat Trick, Evolving Hockey, or NHL Edge.
Seattle Kraken team-level data
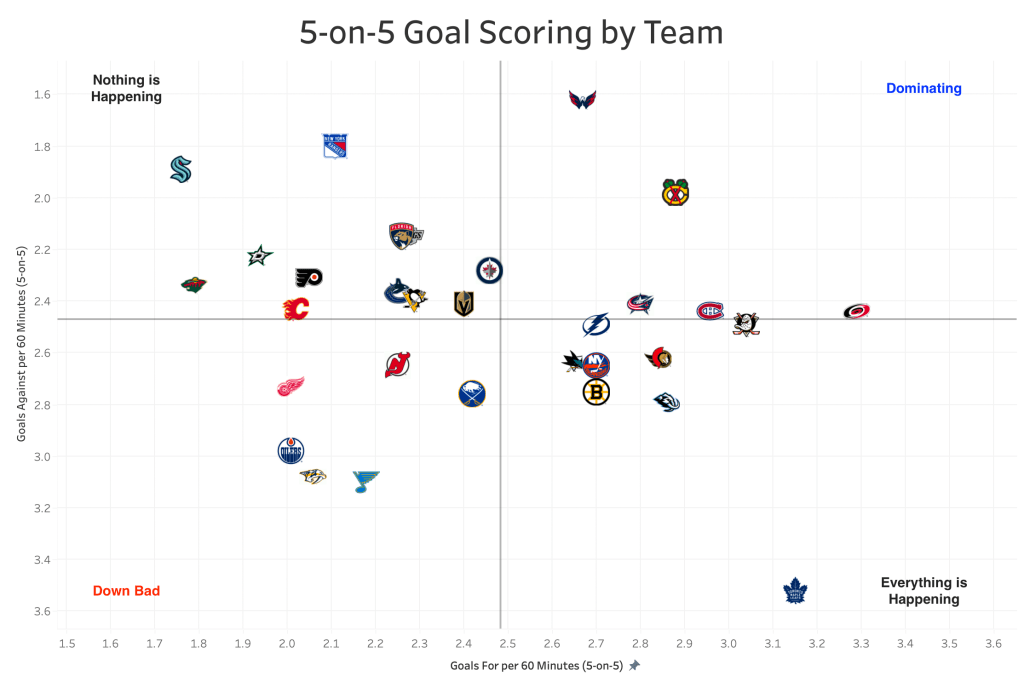
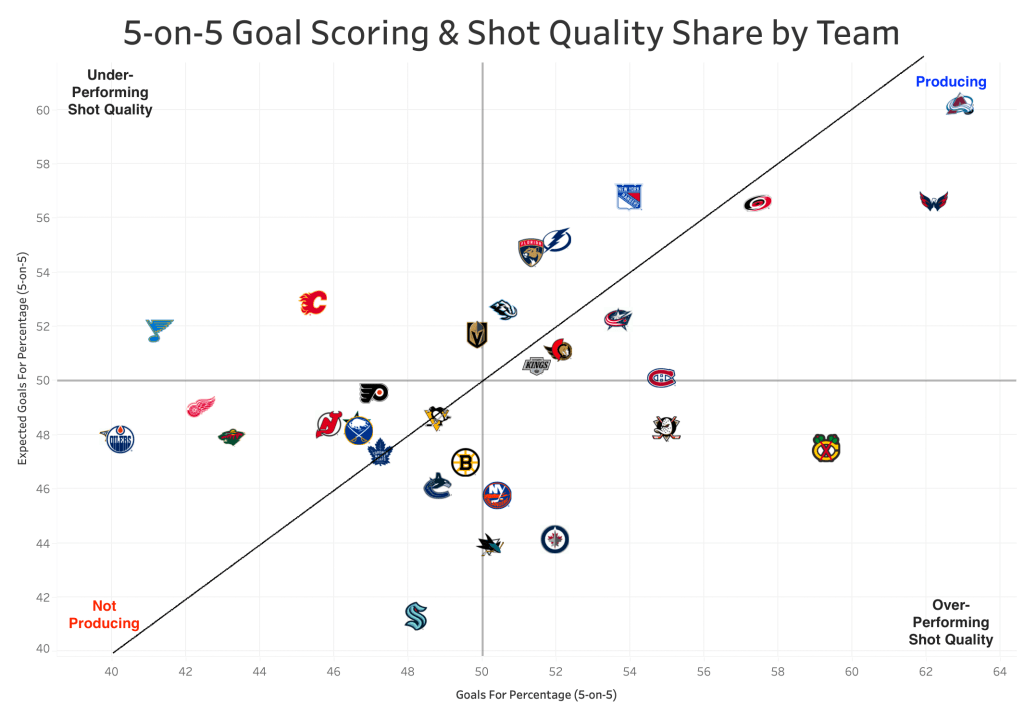
The Kraken are playing a low-event breed of hockey at 5-on-5, scoring the fewest goals per 60 minutes and conceding the third fewest goals against per 60.
Graphically, you can find Seattle on the top left corner of the chart below. Pucks aren’t going into the net for either team in standard gameplay situations. This is not necessarily unexpected given the historical character of Lane Lambert’s teams, the talking points when Lambert was hired, and the historical strength of this Kraken core as being sound defensively.
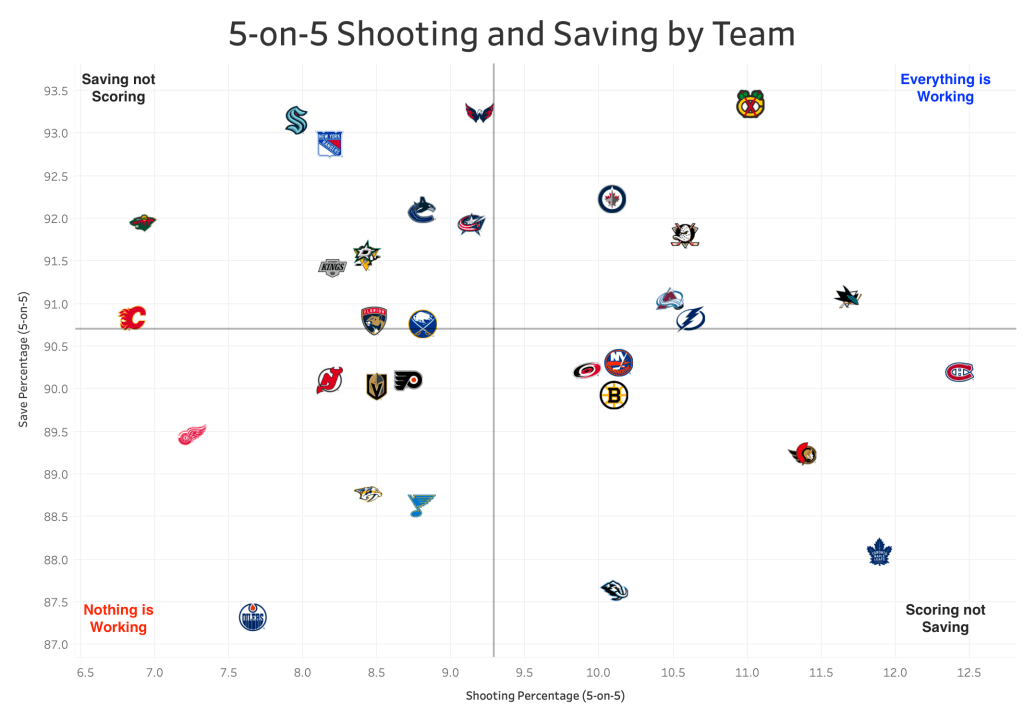
One factor that can elevate an otherwise average team is a hot run of finishing shot attempts and saving shots on goal by the opponents. This is often called “PDO” in hockey circles, though I don’t believe it is actually an acronym for anything. PDO is the sum of a team’s shooting percentage and save percentage. If the number is significantly above or below 1.00, it raises questions about whether there is luck involved or something more sustainable happening. Seattle’s early-season PDO comes in near that average, though notably with strong goaltending results and a weaker shooting percentage.
Could the lower shooting percentage be related to a team struggling to create quality chances? When looking at the Kraken’s 5-on-5 expected goals data from Evolving Hockey, we do see a team struggling to produce offense—perhaps more so than any other team in the league.
(For those requiring a bit more explanation, expected goals—or “xG”—is a metric that estimates the likelihood of a shot attempt resulting in a goal. Public models are based primarily on shot location and type. Proprietary models used by teams often have more pre-shot information, including passes or the presence of a net-front screen. Those private models seem to be similarly pessimistic about the Kraken’s 5-on-5 shot production, though.)
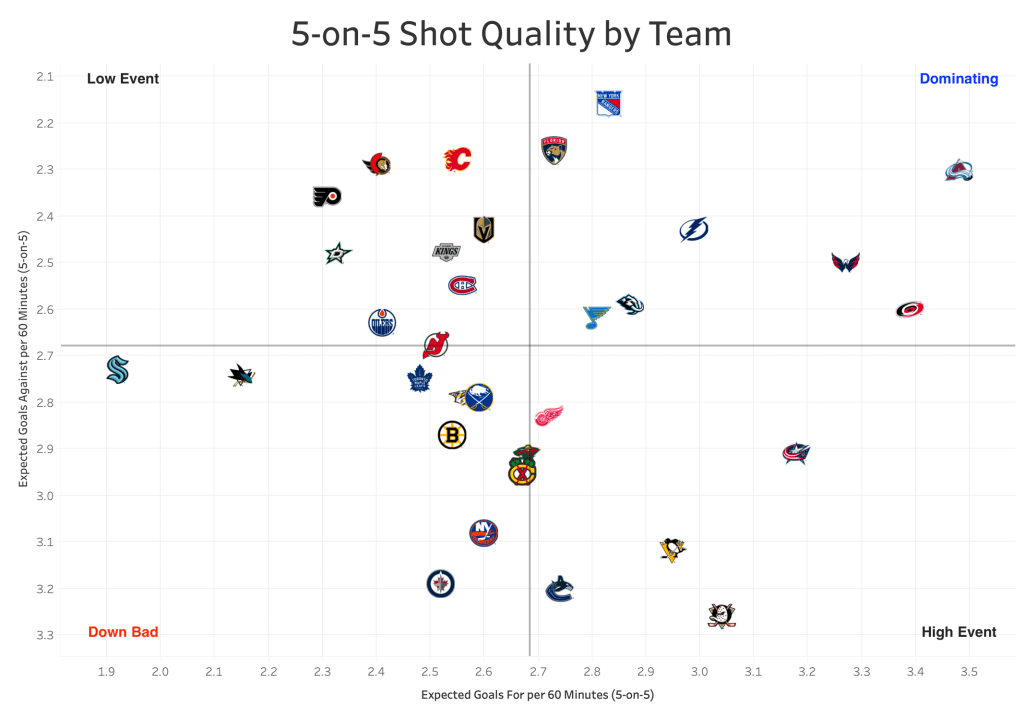
Defense is the area where we see the biggest contrast between actual and “expected” results. As we see in the chart above, Evolving Hockey has the Kraken closer to league average defensively, whereas the actual results have been quite strong.
When paired with the low expected-goals-for number for Seattle, Evolving Hockey has the Kraken with the lowest expected-goals-for percentage in the league at 5-on-5. (Expected goals for percentage—or xGF %—compares a team’s total “xG for” with “xG against.” For example, if a team has taken three shots worth .1 xG total and given up one shot worth .05 xG, the team’s xGF% is calculated .1/(.1+.05) = 67%.) The actual results are significantly better and closer to average.
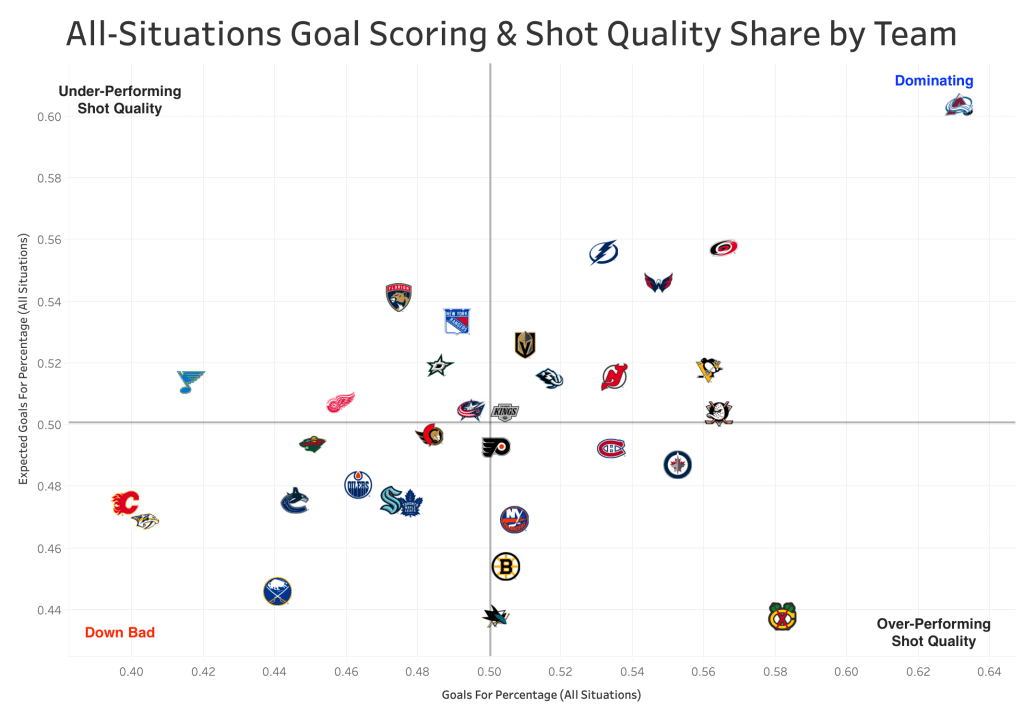
When looking at “all situations” goal scoring share and shot quality share, the picture is better for Seattle. This look includes goals and shot events from special teams with all other even-strength scenarios. While we’ll continue to hold off on specific commentary on special teams in isolation, it must be noted that the overall offensive picture is not nearly as bleak as the 5-on-5 shot quality and scoring numbers suggest.
Seattle Kraken player-level data
For the remainder of this post, we’ll be examining player-level data at “even strength,” rather than “5-on-5.” NHL Edge, the NHL’s public source for player and puck tracking data, provides “even strength” information, rather than “5-on-5.” So, to keep the data consistent across the various sources, I used “even strength” for everything. All this means is that the numbers from here on include data from 4-on-4 and 3-on-3 situations.
Jordan Eberle, Jaden Schwartz, and Shane Wright have paced the team in scoring production at even strength. Matty Beniers doesn’t have a goal yet, but does have five primary assists, which leads the team. While injuries have played into this in some cases, it’s notable that Eeli Tolvanen, Kaapo Kakko, Berkly Catton, and Freddy Gaudreau have not yet scored at even strength.
A recent note from hockey analytics personality JFresh had me curious to look into the difficulty of the assignments each Kraken player is facing. This can be measured by the strength of the competition the skater faces as well as the player’s deployment context (i.e., more time starting in the defensive zone).
As one might suspect, the team’s fourth-line centers (Freddy Gaudreau and Ben Meyers) have started in the defensive zone quite often. However, no player has faced a more difficult combination of defensive-zone starts and competition than Chandler Stephenson.
(Note that the size of the player’s image in the remaining charts correlates to total even-strength time on ice. This is important context. While Meyers and Gaudreau have started in the defensive zone more often on a rate basis, they have been out there much less overall than Stephenson.)
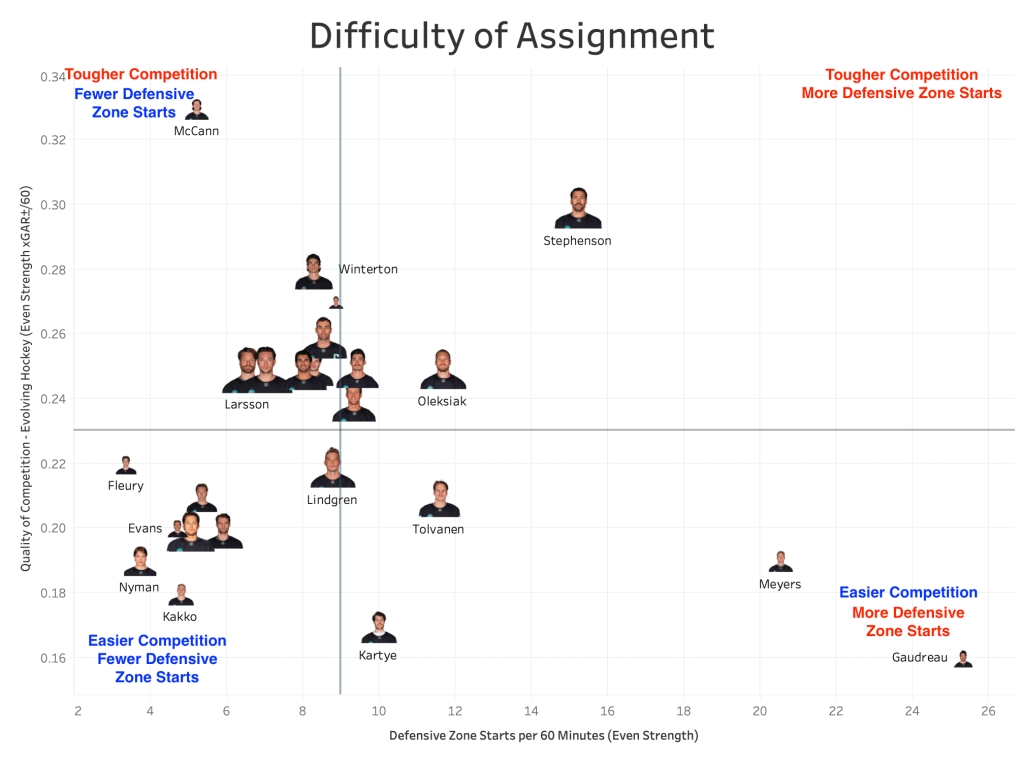
In terms of offensive zone starts for Seattle’s forwards, Stephenson and the fourth-liners start in the offensive zone the least frequently. On the blue line, we see that Jamie Oleksiak gets more defensive-zone starts and fewer offensive-zone starts (on a rate basis) than any other defenseman.
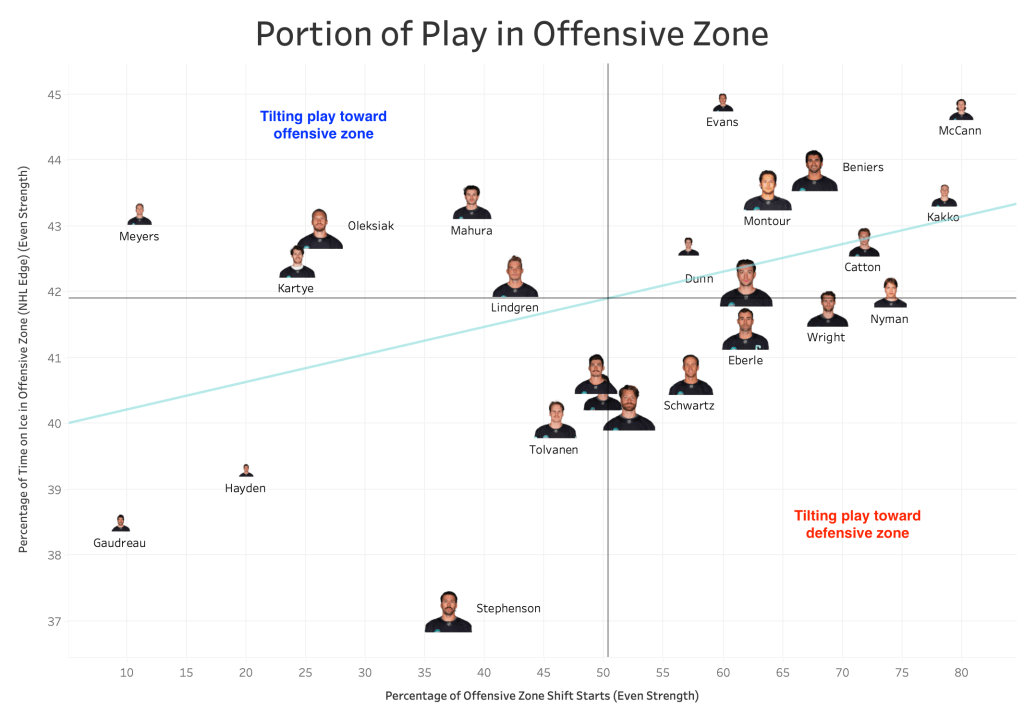
What happens then? NHL Edge gives us data on how much time each player spends in each of the three “zones”: offensive, neutral, and defensive. We can compare a player’s starts against where on the ice he actually plays to see whether he is driving play toward the opponent’s net —or failing to do that and stuck playing defense.
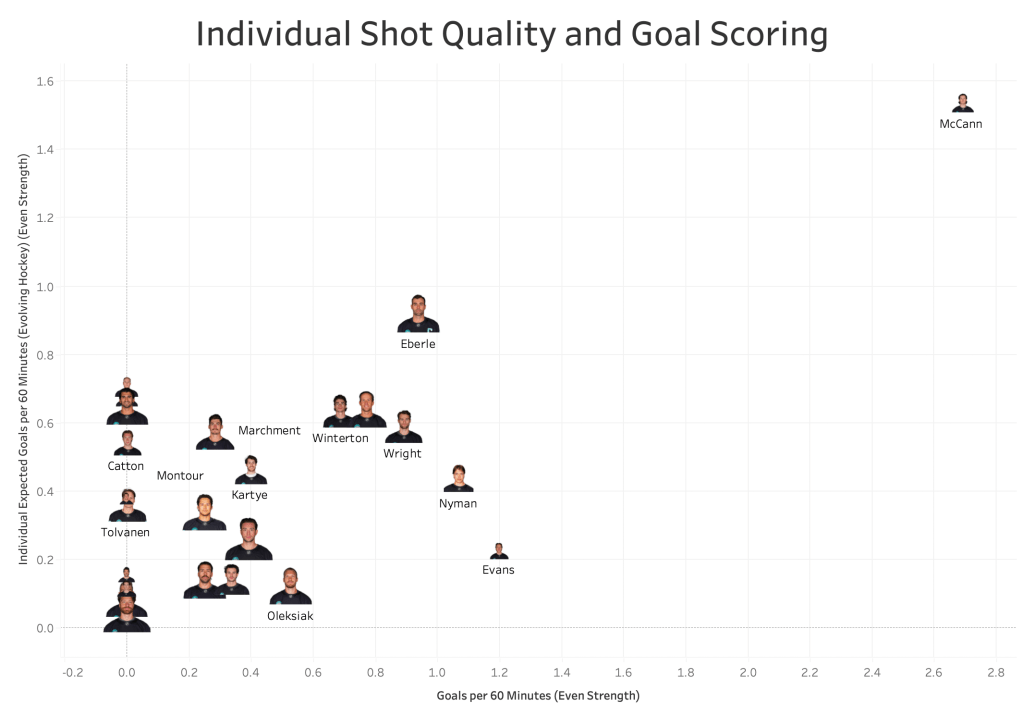
With assignment difficulty in mind, how are Seattle’s skaters producing offensively? One fact is obvious: The recent injury-related absence of Jared McCann is keenly felt.
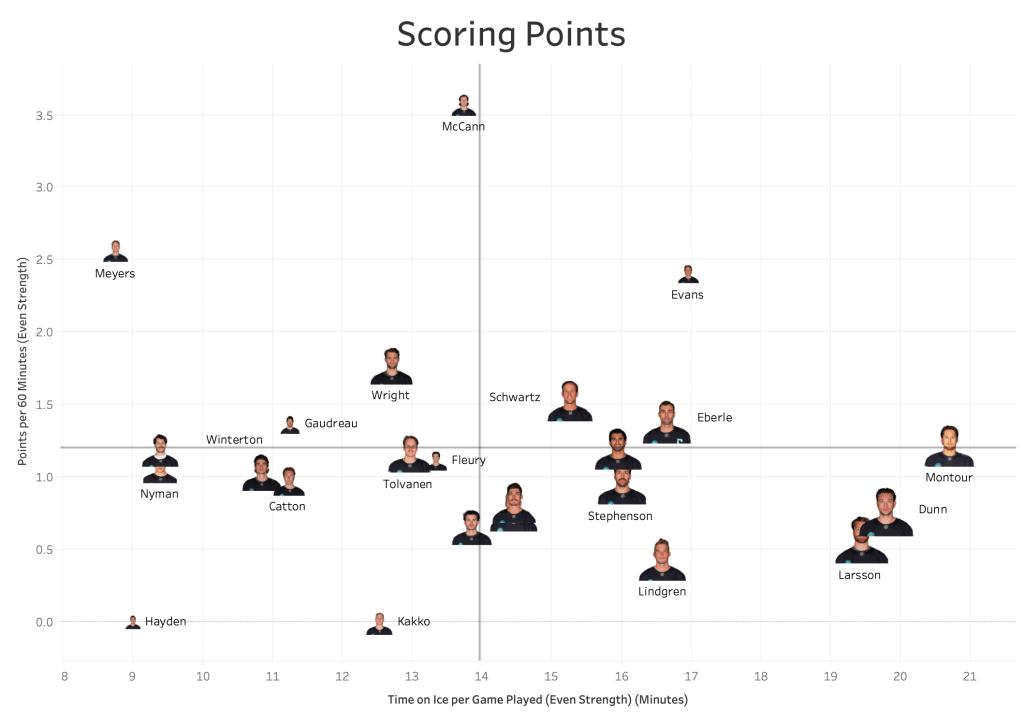
Indeed, McCann breaks the graphic on individual goal scoring and shot quality production. Without McCann in the lineup, Seattle has been leaning heavily on Eberle, Schwartz, and Shane Wright to carry the load. Despite some early questions about Ryan Winterton’s offense, it is notable to see him among the team’s more productive forwards at this point too. We will have to see what happens as the sample size gets bigger. Obviously, more is needed from the likes of Kakko, Tolvanen, and Catton (if he sticks in the lineup).
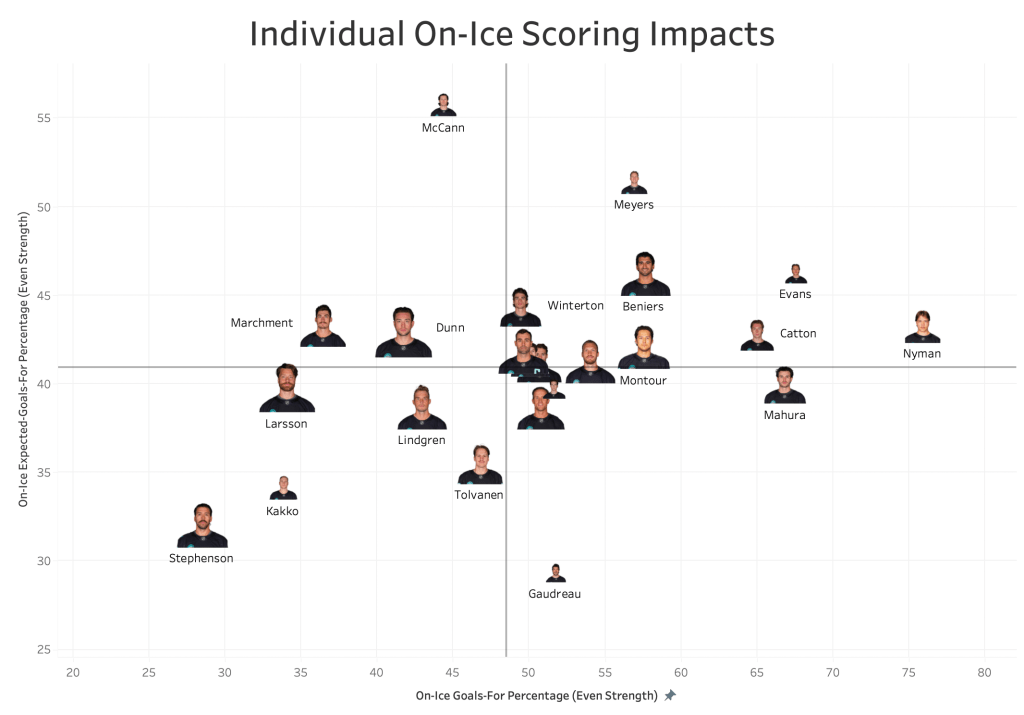
Several Kraken players, including notably Beniers, Branon Montour, and Oleksiak (despite his difficult assignments) have been on the ice for more goals scored than given up at even strength. Only McCann and Meyers (in limited samples) have been on the ice for more shot quality for than against. Stephenson (in difficult assignments) and Kakko (in a limited sample) have seen poor actual and expected results while on the ice.
Any areas for follow-up or additional questions? Let us know in the comments below.

Curtis Isacke
Curtis is a Sound Of Hockey contributor and member of the Kraken press corps. Curtis is an attorney by day, and he has read the NHL collective bargaining agreement and bylaws so you don’t have to. He can be found analyzing the Kraken, NHL Draft, and other hockey topics on Twitter and Bluesky @deepseahockey.