
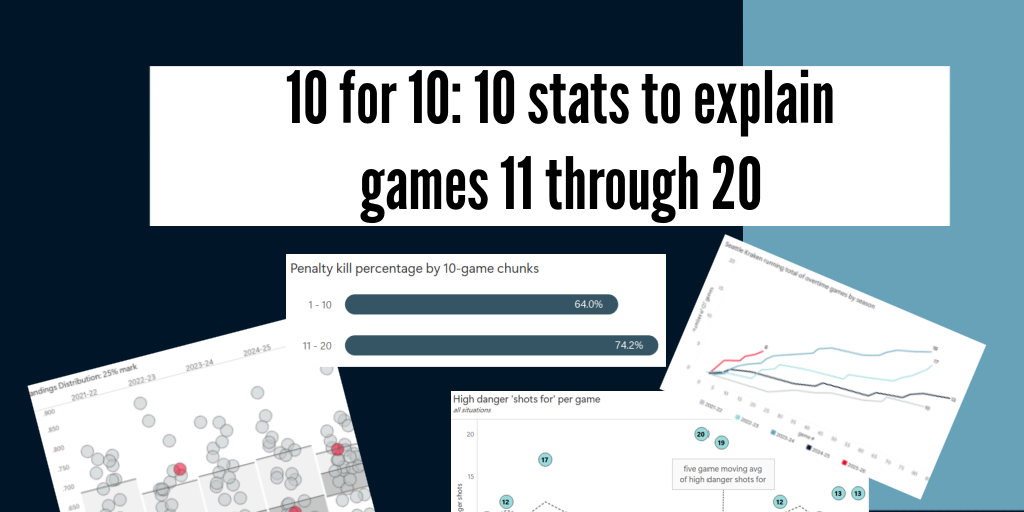
We’ve hit another 10-game checkpoint in the season, which means it’s time for the next installment of 10 for 10: a quick look at 10 stats from the last 10 games that help show how the Kraken are trending.
The first stretch of the season saw the Kraken pick up 13 out of 20 points. Over Games 11 through 20, they grabbed 12 points. The output wasn’t identical, but pretty darn close, and surprisingly consistent for a team still searching for its identity.
Let’s dig into what stood out.
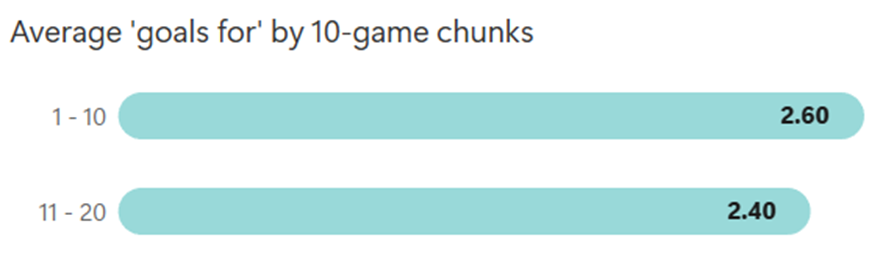
Data Point 1: Goals scored
The Kraken keep banking points, but the goal scoring drought is still very real, and somehow, it’s actually gotten worse over the last 10 games.
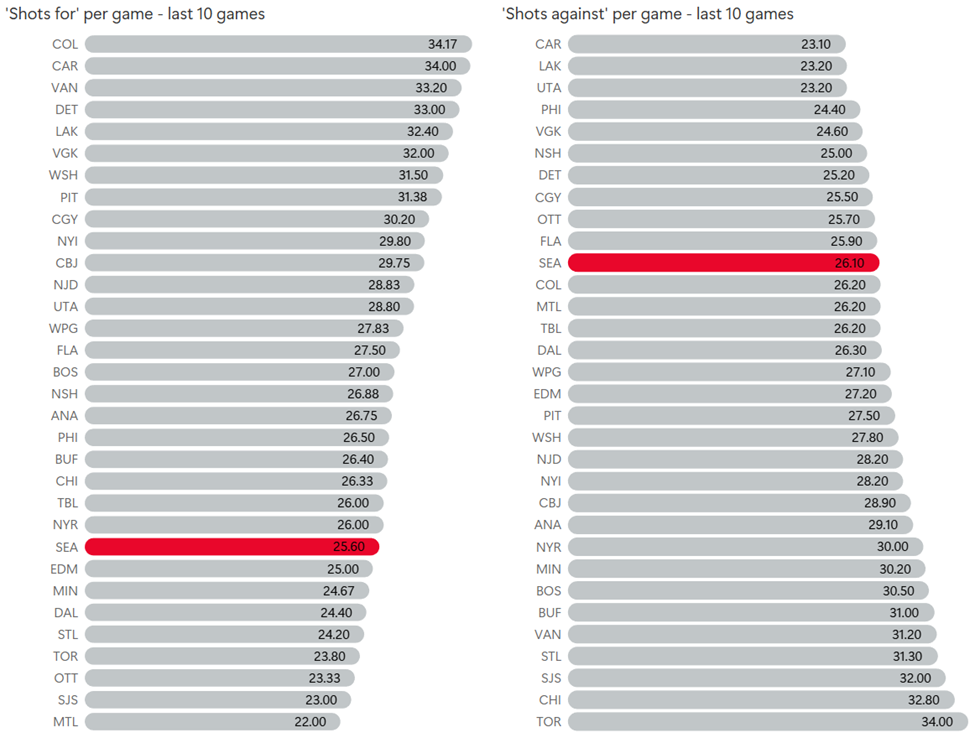
Data Point 2: Shots for and against
If it feels like the coaching staff has been hammering the “shoot more” message lately, it’s because they have. Lane Lambert brings it up almost every night, and the emphasis on generating more offense has been clear.
That said, over the last 10 games, the Kraken still rank just 24th in shots on goal. On the flip side, the defensive structure is holding strong: they rank 11th in fewest shots against per game.
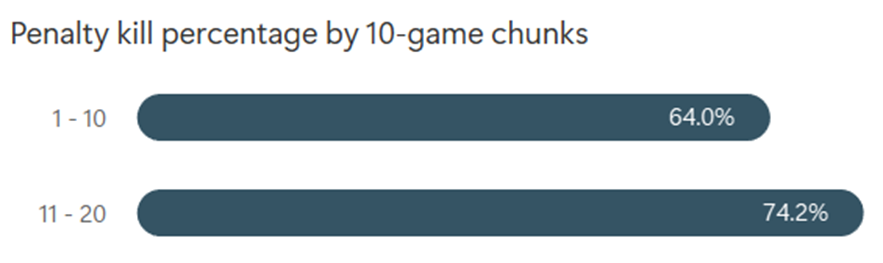
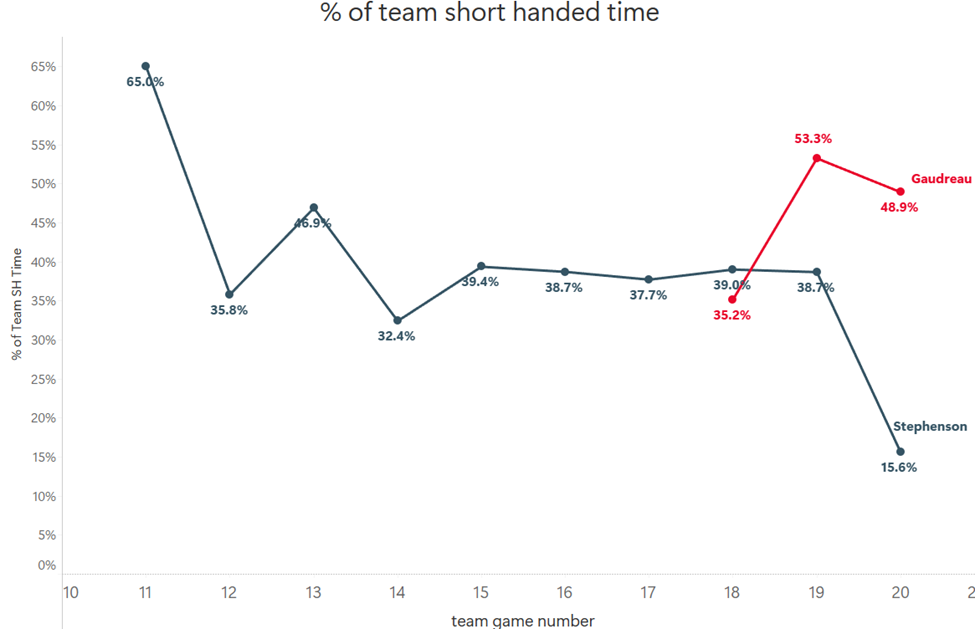
Data Point 3: The penalty kill
The Kraken have allowed a power-play goal in eight straight games, but oddly enough, their overall penalty-kill percentage over the last 10 games is better than it was in the first 10.
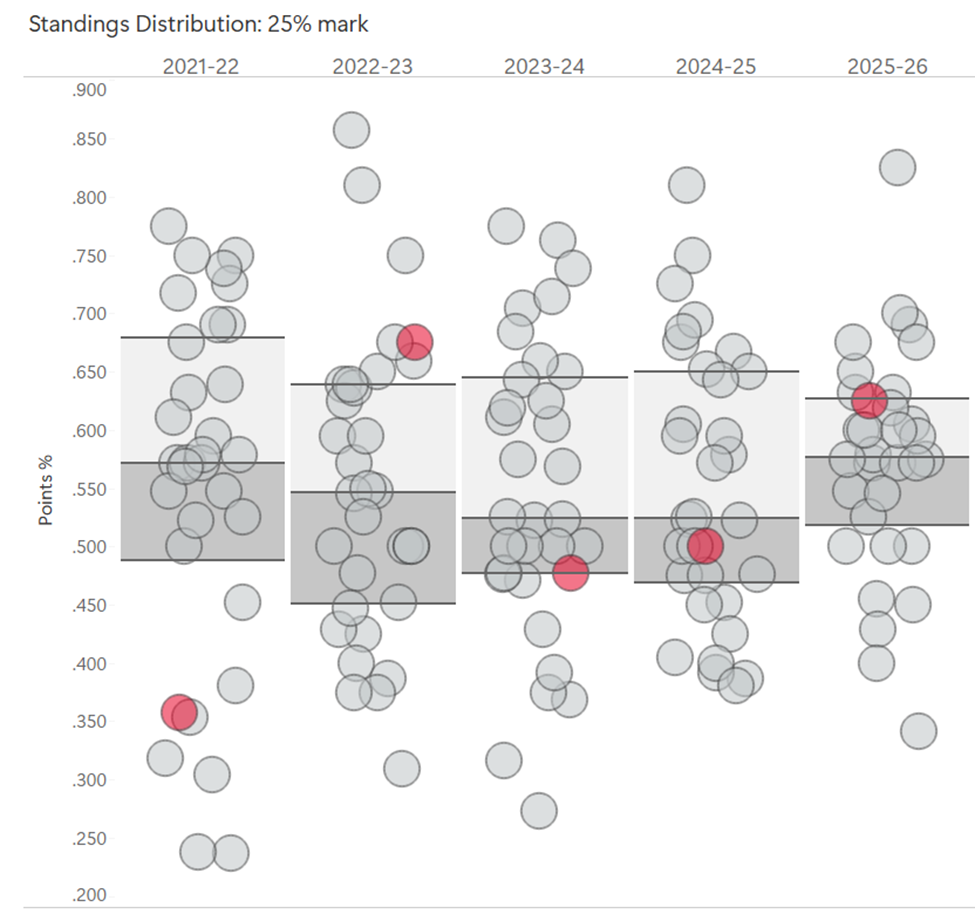
Data Point 4: Crowded standings
This is more of a leaguewide trend, but it affects Seattle directly. The standings are extremely tight right now, with only Colorado really separating from the pack. Traditionally, roughly 80 percent of teams holding a playoff spot at U.S. Thanksgiving go on to qualify, but with the standings so jammed, that old rule might face a real stress test this year.
Data Point 5: Scoring from the defense
With Ryker Evans back in the lineup, the Kraken now have three defensemen who can legitimately drive offense. That’s a rare luxury, and it’s reflected in the percentage of team goals coming from the blue line.
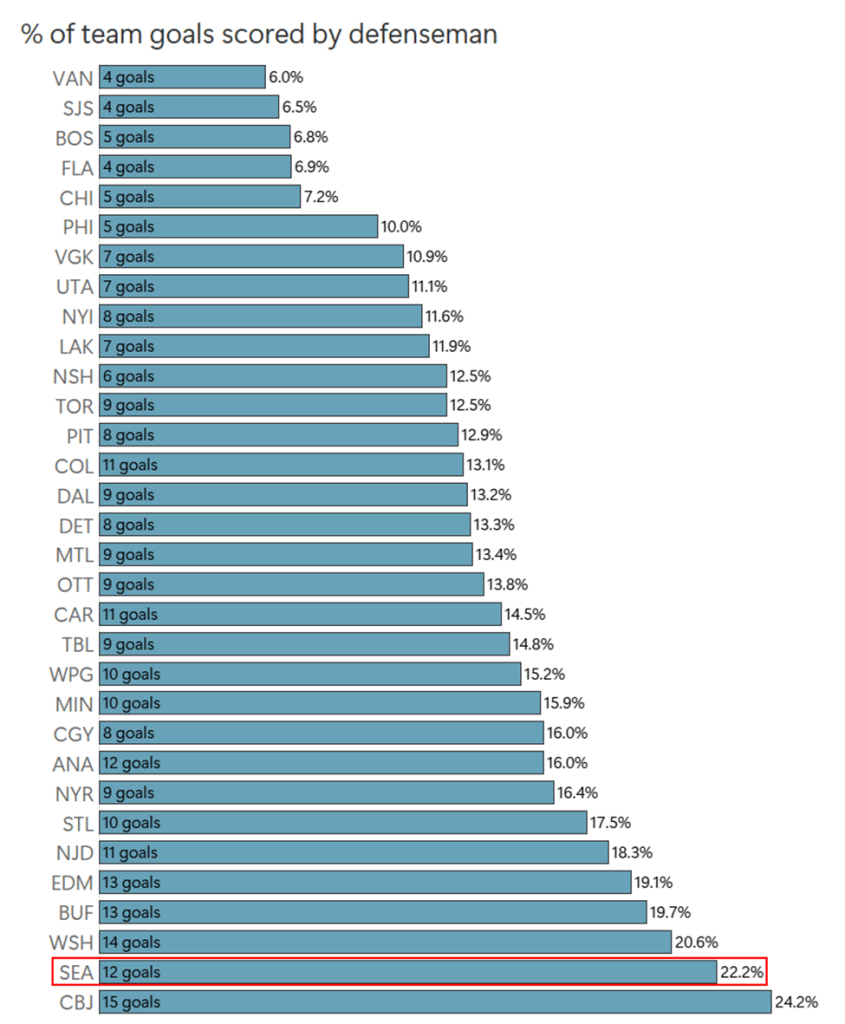
Of course, the flip side is that the forwards aren’t scoring nearly enough, which ties back into the bigger goal-scoring issue.
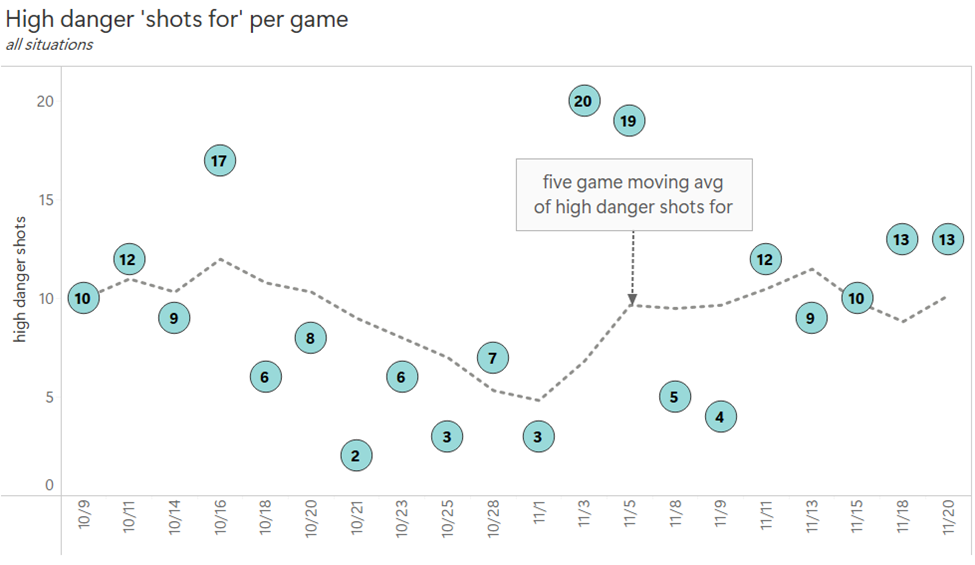
Data Point 6: High-danger shots
The Kraken may not be filling the net, but they are generating more high-danger chances lately. If they keep trending upward here, goals should eventually follow.
Data Point 7: The “old guys” are leading the way
For a team that’s fighting for every goal, it’s notable that the two oldest skaters on the roster, Jordan Eberle and Jaden Schwartz, are tied for the team lead with eight goals each and collectively off to one of their strongest collective starts.
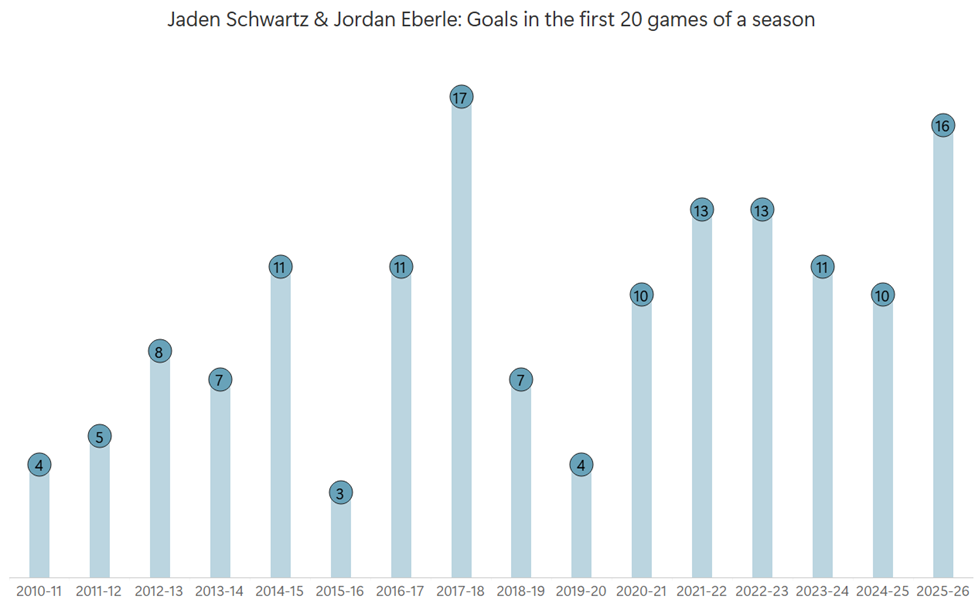
And right behind them? Shane Wright, sitting third on the team with five goals.
Data Point 8: The return of Freddy Gaudreau
Freddy Gaudreau’s addition this summer looked like a clear upgrade for the penalty kill. The penalty kill dipped while he was out, and although it hasn’t fully rebounded, the Kraken coaches seem to like what he brings to the PK based on the minutes he’s getting since coming back from injured reserve.
Data Point 9: Time spent leading
The Kraken have scored first in 12 of their 20 games so far and earned 16 out of 24 possible points in those situations. Still, they haven’t actually held the lead for long stretches this season.
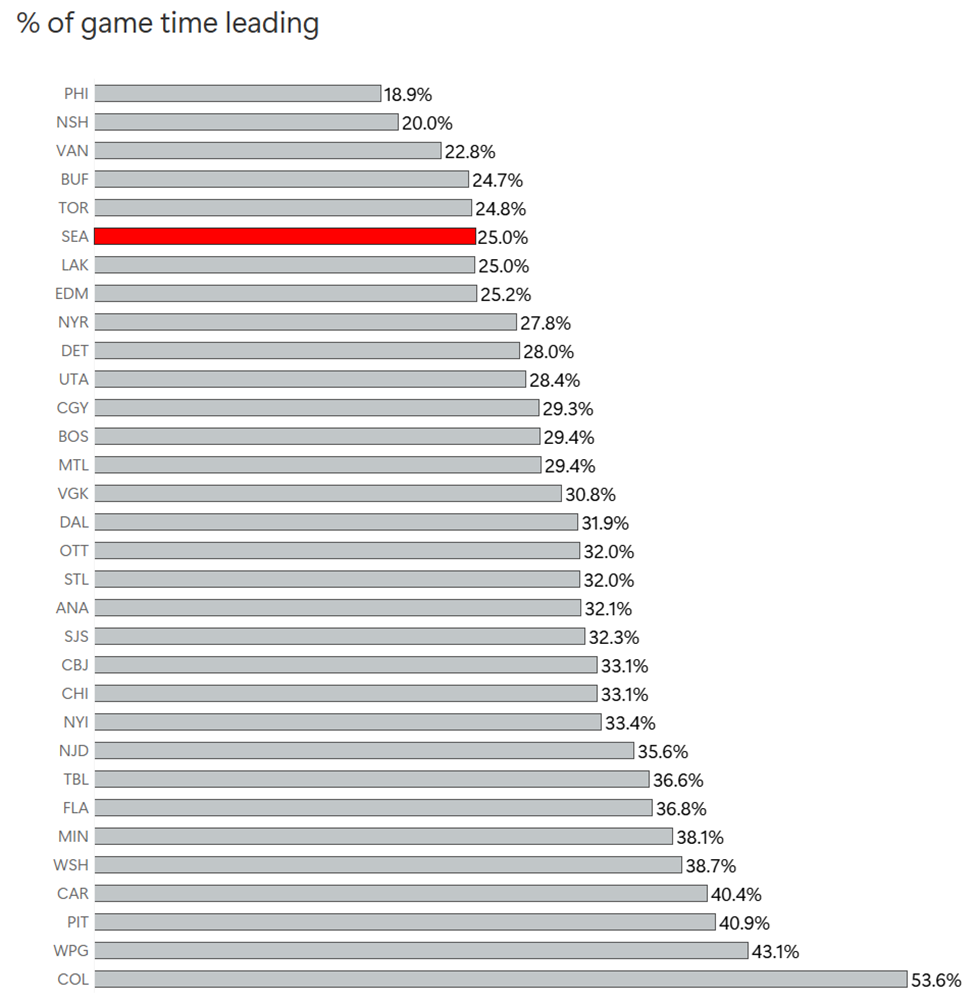
Spending a lot of time leading isn’t a requirement considering their overtime win in St. Louis, which never actually included a second where they were leading in the game.
Data Point 10: Overtime games
One big driver of the Kraken’s early success has been their ability to get games to overtime. Some fans think the record is being “propped up” by all the OT points, but to me, that speaks more to how competitive this team has been and how comfortable they are in tight games.
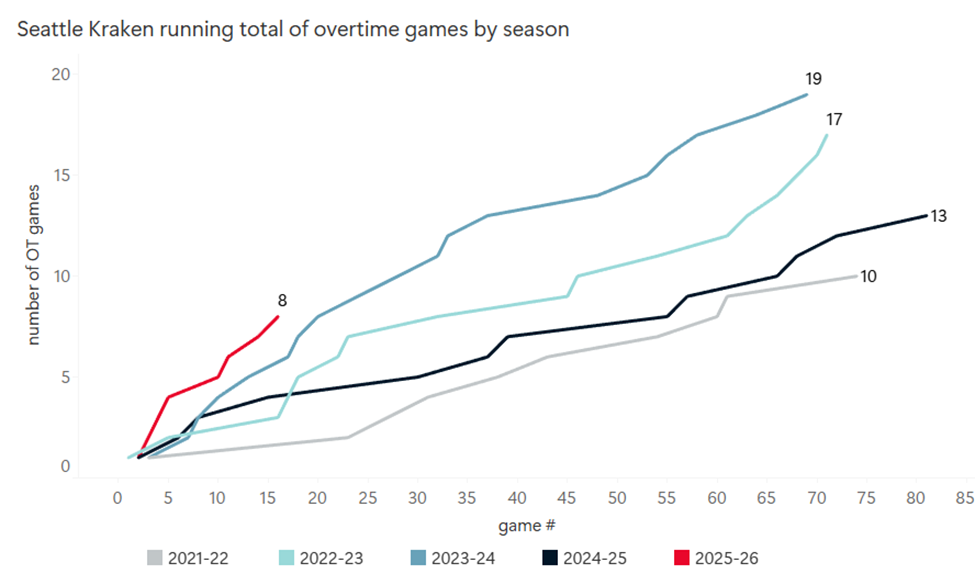
For context: yes, Seattle has had a lot of overtime appearances, but four teams have had even more. Edmonton leads the league with 10.
Closing thoughts
That wraps up this edition of 10 for 10. As before, the numbers paint both promise and frustration: strong structure, better high-danger chances, solid defensive play… but still waiting for the goal scoring to catch up.
Now, I’d love to hear from you.
What stats or trends would you like to see included in future 10 for 10 breakdowns? Are there areas of the game you want a deeper dive on—special teams, matchups, advanced metrics, anything else? Let me know, and I’ll work them into the next installment.