

Like most NHL coaches, the Chicago Blackhawks’ Jeff Blashill is big into analytics, looking for all the information he can get on his team. Unlike most NHL coaches, he’s also willing to engage with reporters on the topic. After a recent practice in Los Angeles, Blashill suggested that not only do the Blackhawks’ internal analytics differ from the publicly available models, they’re superior. That sparked this conversation between The Athletic hockey writers Mark Lazerus and Dom Luszczyszyn.
Lazerus: Anyone who’s ever sat in an NHL press box has heard them: the three or four gentlemen in official black NHL blazers, shouting out numbers over each other, constantly correcting each other, desperately and frantically trying to keep up with all the minutiae of the fastest game in the world. It’s not much different than the volunteers at a high school football game trying to decide which player gets credit for a tackle. The sport is chaos. Tracking it is chaos, as well.
Being an official NHL scorer is incredibly difficult, and I don’t mean to mock them. But I’ve always wondered just how accurate publicly available statistics and analytics are, considering how heavily they’re based largely on what these poor guys are trying to do. I greatly value the insight that metrics such as expected goals and goals saved above expected provide, and I use them regularly in my stories. Still, I’ve always carried some skepticism about them, as well, for just this reason. Is that fair, Dom?
Luszczyszyn: General mistrust for the four guys shouting over each other was probably the right call when they were the ones solely in charge of determining where a shot was taken. Those guys were famously inaccurate enough to be noticeable on a shot-to-shot basis. Though the degree to which they were off was mostly washed away over a large enough sample, I don’t think this is a huge concern anymore now that the job has mostly been outsourced to The Machines.
The guys shouting numbers are still there for quality control and double-checks, but since the NHL entered its puck-and-player-tracking era five years ago, shot location accuracy has become a lot more trustworthy. There are other reasons to be skeptical about public expected-goals models, but this old one has been mostly solved.
Lazerus: That’s comforting to know. The main reason I wanted to have this chat with you was a recent conversation that Chicago Sun-Times hockey writer Ben Pope and I had with Jeff Blashill after a practice in Los Angeles, which seemed to back up that skepticism. Blashill has consistently suggested that the Blackhawks’ internal analytics are superior to the publicly available models out there. So I wanted to run some of his thoughts by you, Dom, as the proprietor of one of these models.
Natural Stat Trick, for example, says the Blackhawks are one of the worst teams in the league in terms of scoring chances and scoring-chance ratio. At the time of our discussion on Friday, they had the Blackhawks 27th; after a ghastly weekend against the Kings and Ducks, they’re now 31st. Blashill values scoring chances and “Grade-A” chances above all else, and says the Blackhawks’ internal numbers are more favorable to his team than the public models. Not that Chicago is at the top of the league or anything, but noticeably higher in the overall rankings, and commensurate to its solid but unspectacular record (which many, including you and Sean Gentille in your weekly power rankings, seem skeptical of). Blashill also said that the internal model has a far stricter definition of what constitutes a scoring chance, so the numbers are down across the board compared with public models.
“Most of the public data, to be super honest, isn’t great,” he said. “I don’t think their expected-goals models are elite; I think they’re OK. Generally, internal models are much better, at least of the three different teams that I’ve been to (Detroit, Tampa Bay and Chicago). Especially if you’re only judging your own game, because if you’re only judging your own game, your scoring chances are done by the same individual over and over again. … A group like SportLogiq has worked hard to try to modify (its model) and make it better, and that’s what we do internally. We work with our analytics people and we go through it. But yes, I would say it’s much, much more stringent than what the public models are. I think a lot of times some of those public models, it’s another version of shots. So if you out-shoot them, you get more scoring chances, because they’re giving the scoring chances easier grades.”
It does seem logical that having one person watch every one of a team’s games and track scoring chances by hand is naturally going to be more accurate — and more consistent, game to game — than scraping data from the official play-by-play, even with player tracking technology. Or does that vastly underestimate the thought and care and nuances that go into the public models?
Luszczyszyn: As a typical stats guy, my answer to that is: yes, maybe and also no.
I don’t think there should be any doubt that private xG models are going to be better than public ones. And for the same reason, I think One Dude Watching And Counting Scoring Chances will probably also be better when it comes to scoring chances, too. The reason for that is the difference between what constitutes a scoring chance from a public and private model perspective. A private model has a lot more access to data that naturally makes a shot more dangerous — something One Dude Watching would also know.
A scoring chance is often “you know it when you see it” and what you “see” is captured a lot better by a private model.
All the public models are limited by what the play-by-play files offer, and end up looking at the same thing: specific shot location and shot angle, with inferences of whether the shot is a rebound or off the rush. Those inferences help, and there’s a lot of “thought and care” that makes it all work long-term, but it’s obviously going to be far from perfect without actual access to data. A private model won’t have to infer; it knows. It’ll be more accurate in that way, knowing not only that it is a 100 percent confirmed rush, but also exactly what kind of rush it is. For rebounds, it’ll have a lot more information about the chaos surrounding the crease and whether the shot is more likely to go in because of it.
The big difference, though, is pre-shot movement. A shot is a lot more likely to go in if a pass preceded it, especially if it makes a goalie move. Public models will have no idea about these types of shots. Private models and One Dude Watching will. That means a cross-crease pass outside the scoring-chance zone won’t be counted as a scoring chance publicly, but it will be privately.
With that being said, there will be a big difference between any model, public or private, and One Dude Watching — especially if he’s a team employee. Humans with a rooting interest will always have an implicit bias that will show up in the numbers in a way The Machines won’t. It may be consistent, but there will likely be a consistent bias baked in.
That’s especially true if we’re only looking at the dichotomy of “is or is not a scoring chance” — there are degrees to goal likelihood that go beyond “Grade-A” chances and regular chances and everything else. If a team gives up one “Grade-A” but a whole mess of other chances, and a lot of volume from the outside, that’s going to add up in a way that’s not properly reflected by “scoring chances” or One Dude Watching.
That’s where it becomes a public vs. private xG question where, yes, private stuff is better, but the end result is a lot closer than it’s made out to be (sorry, Chicagoans). And you can make a lot of inferences beyond xG using real goals to get the rest of the way.
Lazerus: That’s genuinely fascinating. Short of hiring an army of human game trackers, is there any way for The Machines — buoyed by their rock-solid, objective consistency but hampered by their lack of in-game context — to incorporate more nuance into their models, to factor in the pre-shot puck movement and the true danger of a scoring chance? I know the NHL is stingy about what it makes publicly available from its game-tracking technology.
And what about the players themselves? Surely a one-timer off a cross-slot pass is more dangerous coming off the stick of Leon Draisaitl or Alex Ovechkin or Connor Bedard than a fourth-line grinder or third-pairing defenseman. Do — or perhaps more precisely, can — the models give more weight to players who are proven high-percentage shooters, particularly from areas of the ice from which they’ve scored frequently in the past?
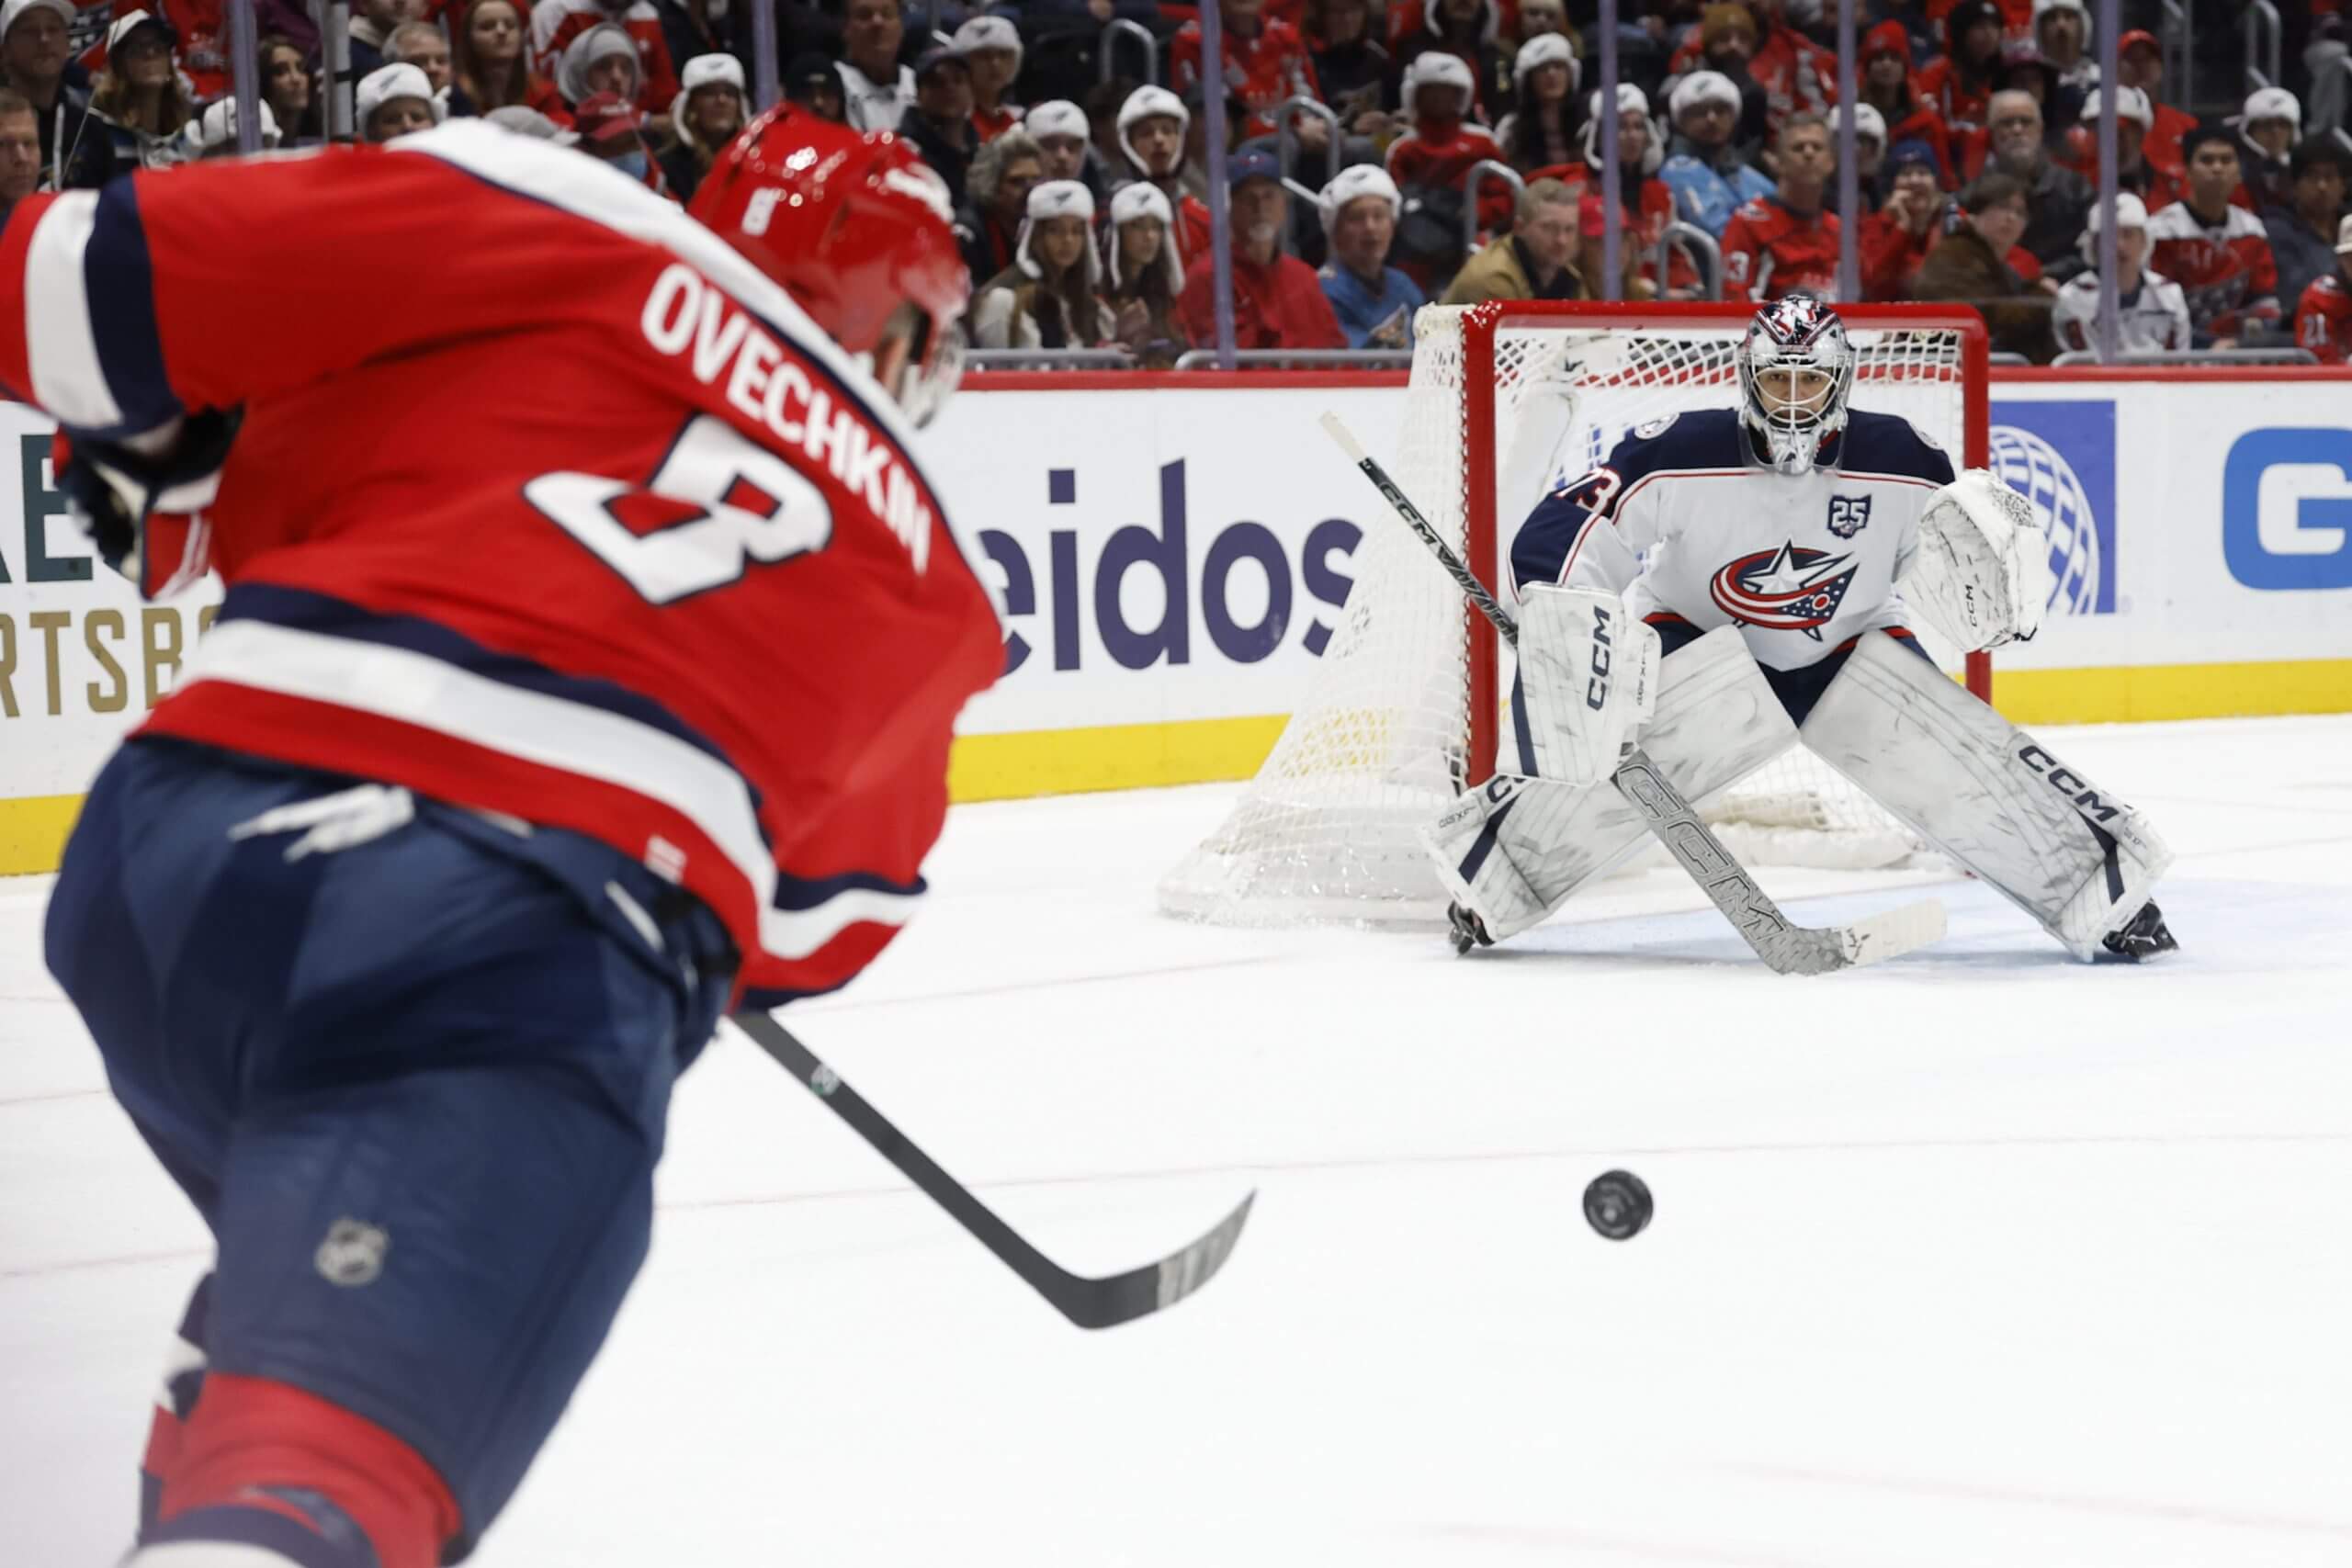
Alex Ovechkin’s elite shot gets pucks in the net far more than the average NHL player. (Geoff Burke / Imagn Images)
Luszczyszyn: In terms of pure xG, it’s a data limitation issue. What you see is what you get there, and I don’t think there’s anything that can be added currently with the NHL being stingy on what’s publicly available. The models can account for who’s shooting using their historic precedent, but the general consensus is to treat that as two separate skills. It’s usually more helpful to know what Connor Bedard’s finishing ability is above what an average shooter taking the same shots is, and then factor that in separately.
That’s where the “more nuance” comes into play, where a model trying to estimate a team’s total ability will usually go well beyond just its xG. It’ll include its finishing talent, play-making ability, goaltending, strength of schedule and track record — all in an attempt to parse through hockey’s chaotic web. It’s just that some parts of that web take more time to reveal themselves as real, partly due to sample size. There are a lot more chances in a game compared to actual goals, and that makes it a bit safer to use until a player/team builds a believable profile of all the other stuff. A player shooting at 22 percent over 15 games is probably a hot streak. A player doing that over 150 games has built enough of a track record to start expecting that level.
Without the nuance of a model doing all of that and factoring for a bunch of different minutiae, the simplest trick is to try and find the balance between a team’s expected and actual goal output. The Blackhawks were one of the most extreme cases of that earlier in the season but have come back to earth a bit, as many expected. They currently earn 49.5 percent of actual goals at five-on-five and 45.3 percent of expected goals. Their “true talent” likely lies somewhere between those two numbers, with a bit more conviction toward the expected side of the ledger given the sample size. The longer a team performs above expected — think peak Washington Capitals — the more likely it is that the gap between the two is real.
Lazerus: I think that’s a fair assessment of where the Blackhawks are right now. Have they been propped up a bit by Bedard’s finishing ability and Spencer Knight’s consistent brilliance in goal? Absolutely. But when you watch those two players every day, it feels pretty darn sustainable. And it can take a while for the facts to catch up to the feels. Numbers don’t lie, but they can certainly mislead. This is a flawed team, with two incredibly high-end talents masking a lot of the usual deficiencies that come with having five everyday defensemen aged 24 or younger and four forwards in their top six who are 22 or younger.
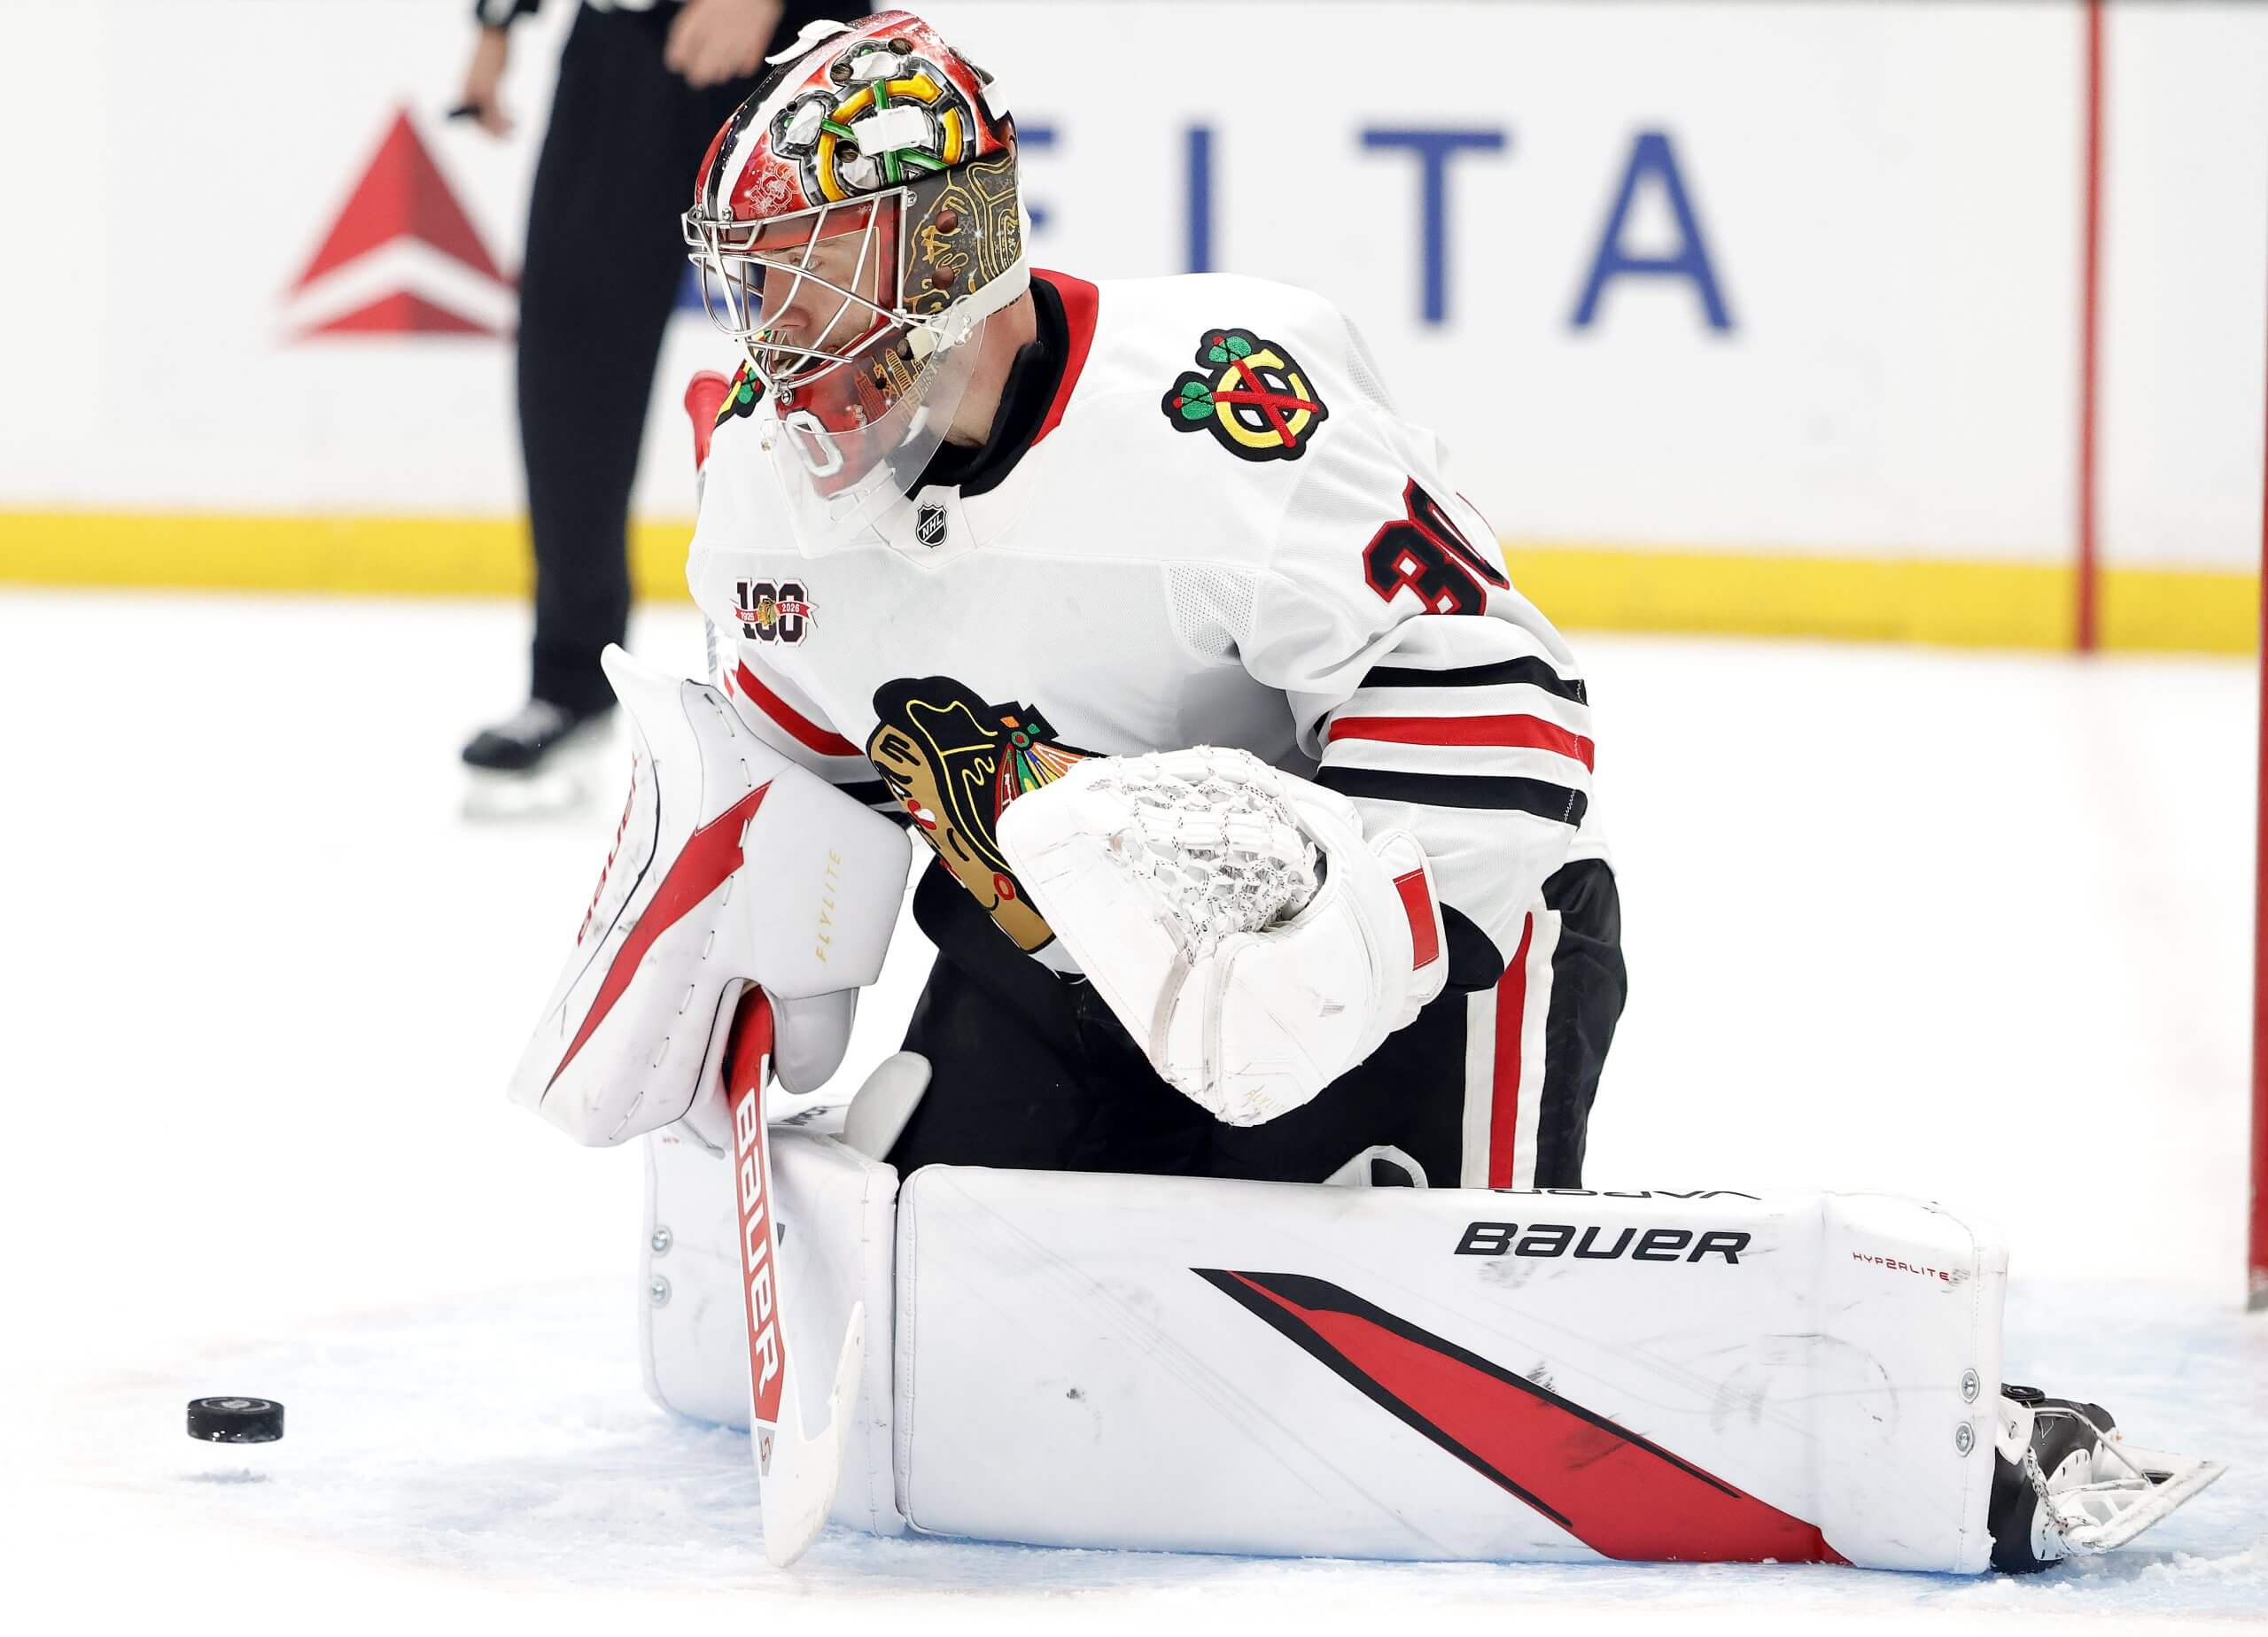
Spencer Knight’s excellent play has helped the Blackhawks to an unexpected rise this season. (Ronald Martinez / Getty Images)
But their record — a respectable but hardly spectacular 12-11-6 after Sunday’s obscenely lopsided 7-1 loss to Anaheim — doesn’t feel egregiously inflated. If anything, their abysmal 1-6 record in overtime might make them look worse than they actually are, because three-on-three, fun as it may be, isn’t real hockey. And that’s what Blashill seemed to be saying. He implied that the team’s internal numbers suggest their record is right about what it should be, while much of the public models seem to think they’re notably worse, and highly unlikely to stay in the wild-card hunt for the next four months.
“That’s the problem with the world we live in,” Blashill said. “It’s hard for you guys, because you can only have the analytics you get. The first thing I do with analytics is dive as deep into it as possible to (decide), do I trust the model or not? You guys don’t have the access to that.”
What we have might not be perfect. And it might not be quite as good as what these billion-dollar companies are putting together in their custom-built analytics departments. But it doesn’t appear all that far off, either.
Luszczyszyn: And to put a bow on all of it, we actually do have some access to the multibillion-dollar stuff. Every month SportLogiq does a power ranking of its own over at TSN where it reveals each team’s expected goal differential in all situations. It’s rudimentary, but it adds some truth to what Blashill is saying: Chicago’s xG is not as bad as the public states. However, it’s still not very good at minus-0.48 per game (this, again, was before last weekend). That’s better than the public’s minus-0.63, but still ranks in the league’s bottom five.
The models aren’t mirror images, but for Chicago, they do point in the same direction: as skilled as Bedard is, as talented as Knight is, there’s still a lot of work left to be done to make the team’s current record sustainable.