
As the 2025‑26 season passes its midpoint, the NHL standings are already telling a compelling story…..dramatic turnarounds, shocking declines, and teams overperforming (or underperforming) relative to last year. Using points percentage… here’s a look at how every team stacks up this season (to date) compared to 2024‑25 Final Numbers…
Team
24/25 %
25/26 %
Change
Sharks
31.7
53.6
+21.9
Avalanche
62.2
82.1
+19.9
Blackhawks
37.2
48.8
+11.6
Kraken
46.3
57.3
+11.0
Blue Jackets
40.2
51.2
+11.0
Predators
41.5
50.0
+8.5
Wild
59.1
65.9
+6.8
Ducks
48.8
52.3
+3.5
Stars
64.6
67.4
+2.8
Utah
54.3
50.3
−4.0
Oilers
61.6
55.8
−5.8
Golden Knights
67.1
58.5
−8.6
Canucks
54.9
45.1
−9.8
Kings
64.0
53.6
−10.4
Flames
58.5
47.6
−10.9
Blues
58.5
44.7
−13.8
Jets
70.7
46.3
−24.4
Team
24/25 %
25/26 %
Change
Flyers
46.3
62.2
+15.9
Penguins
48.8
59.8
+11.0
Islanders
50.0
60.5
+10.5
Sabres
48.2
58.5
+10.3
Red Wings
52.4
61.4
+9.0
Bruins
46.3
53.5
+7.2
Canadiens
55.5
61.9
+6.4
Hurricanes
60.4
63.9
+3.5
Lightning
62.2
65.5
+3.3
Rangers
51.8
52.3
+0.5
Devils
55.5
53.5
−2.0
Blue Jackets
54.3
51.2
−3.1
Senators
59.1
55.8
−3.3
Panthers
59.8
55.9
−3.9
Capitals
67.7
58.1
−9.6
Maple Leafs
65.9
56.0
−9.9
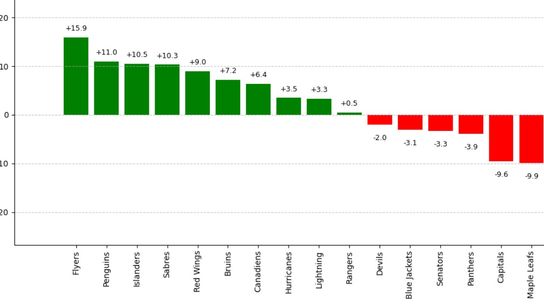
Eastern Conference: Flyers Fly, Capitals Slide
The Philadelphia Flyers have surged to the top of the improvement chart in the East, jumping from a 46.3% points rate last season to 62.2% this year — a +15.9% increase. Under Rick Tocchet, the Flyers are displaying an energized, fast-paced style that’s translating into wins, and this kind of midseason turnaround immediately puts him in the conversation for the Jack Adams Award.
Other notable risers include the Pittsburgh Penguins (+11.0%) and New York Islanders (+10.5%), both exceeding expectations and shaking up the Metropolitan Division. Meanwhile, Buffalo (+10.3%) continues its climb, showing the team’s development plan under Jarmo Kekalainen is paying off.
At the other end of the spectrum, last year’s playoff juggernauts Washington Capitals (−9.6%) and Toronto Maple Leafs (−9.9%) are underperforming relative to expectations, a reminder that past success doesn’t guarantee continued dominance. Florida and Ottawa also see modest declines, while teams like Boston, Detroit, and Montreal are quietly improving — setting up tight divisional races.
Key takeaway: In the East, the story is about the rise of underdogs and the regression of former contenders…..exactly the type of scenario that fuels coaching award debates
Western Conference: Chaos and Dominance
Out west, the trends are just as dramatic. The San Jose Sharks are the story of the season so far, posting a +21.9% improvement — the largest in the league — and reminding everyone that last-place teams can turn things around quickly under the right leadership. Close behind, the Colorado Avalanche are dominating with an 82.1% points rate, up from 62.2% last year, putting them on pace for one of the highest-scoring seasons in league history. The Chicago Blackhawks (+11.6%) and Seattle Kraken (+11.0%) also stand out as major risers, while Anaheim, Minnesota, and Nashville are quietly climbing.
On the flip side, the Winnipeg Jets have seen a staggering collapse (−28.0%), followed by the St. Louis Blues (−13.8%), Calgary Flames (−10.9%), and Los Angeles Kings (−10.4%). Even perennial contenders like Vancouver, Vegas, and Edmonton are slipping slightly.
Key takeaway: The West is a mix of extreme risers and dramatic fallers — a volatile environment where coaching impact is magnified, making this season particularly interesting for the Jack Adams Award race.
WHAT THE EK DOES THIS ALL MEAN??
For the first time in quite a few years we could see a MAJOR influx of new playoff teams,,,perhaps as much as 50%…