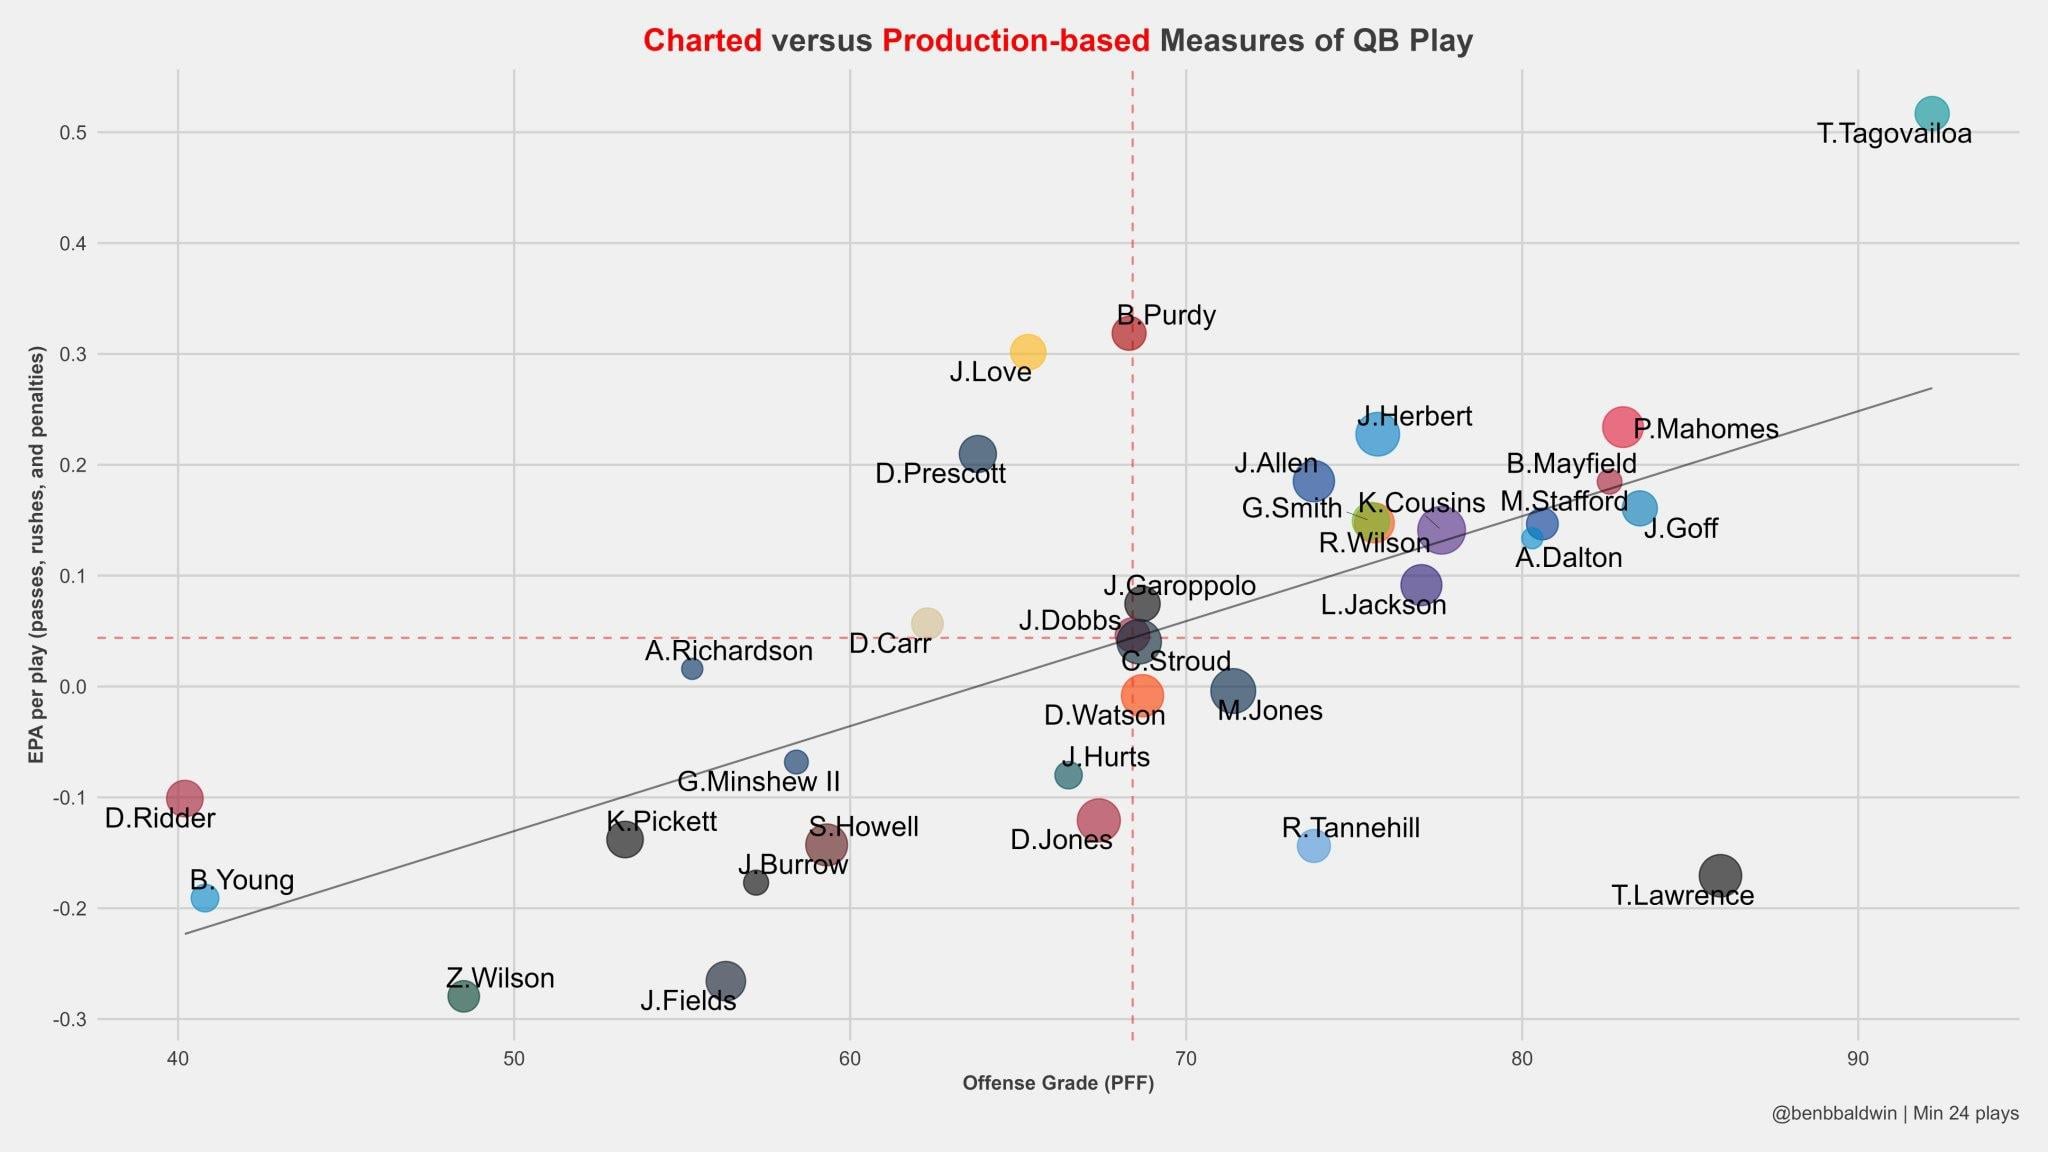
The Y-Axis is essentially measuring how good the QB was.
The X-Axis is measuring how good the offense was overall.
The problem is that they are kind of intertwined.
Like imagine your offense just sucks bad. They constantly get penalties, and the receivers always drop balls.
In such a situation the QB is going to have a horrible score, even if you have Tom Brady.
Similarly, your offense might look awful if your QB is terrible.
So basically this graph doesn’t really tell us much except that the Falcons looked awful on Sunday (which we all already knew)
what’s funny? the Falcons’ QB is rating poorly
Good news. Ridder is playing like the first and second overall picks, without costing a first or second overall pick!
Ridder stans trying to explain how our qb being objectively bad in both the eye test and on paper, isn’t as bad as we think
The only good thing about Ridder being our QB currently is that it’s possible we won’t have to pay a massive QB contract for the next 5-6 years. Unless we go after a huge Free Agent.. which we shouldn’t. Great time to spend on other positions.
What’s this supposed to say exactly?
I don’t think Ridder is the best but he also hasn’t played enough and doesn’t have the best scheme/pass pro. I think the impatience comes from us having skill players and them not having much to work with. Drake and Pitts on paper should be one of the best receiving duo’s in the league.
This means Ridder is better than a lot of the QBs on there… some of y’all need to learn to read a fucking graph.
Y axis is QB quality – X is offense itself.
Tua and the Dolphins having an insane start to the season
He’s terrible man
Not sure why people are saying the X axis (offensive PFF grade) is the grade for the entire offense. Each player individual player is given an offensive/defensive grade by pff. This week Ridder’s offensive grade was an abysmal 40.8, the worst in the league. This plot is showing Expected Points Added as a function of PFF offensive grade per individual. I’m entirely familiar with how EPA works, but it is an advanced stat that is another way of grading a player’s performance. We are here that PFF grade and EPA are roughly linearly correlated. Specifically for Desmond Ridder, despite having the leagues worst PFF grade (again, this is his grade, not the Falcon offense) he is “only” bottom third in if you consider the EPA metric. Interpret that how you will.

10 comments
So kind of a weird graph.
The Y-Axis is essentially measuring how good the QB was.
The X-Axis is measuring how good the offense was overall.
The problem is that they are kind of intertwined.
Like imagine your offense just sucks bad. They constantly get penalties, and the receivers always drop balls.
In such a situation the QB is going to have a horrible score, even if you have Tom Brady.
Similarly, your offense might look awful if your QB is terrible.
So basically this graph doesn’t really tell us much except that the Falcons looked awful on Sunday (which we all already knew)
what’s funny? the Falcons’ QB is rating poorly
Good news. Ridder is playing like the first and second overall picks, without costing a first or second overall pick!
Ridder stans trying to explain how our qb being objectively bad in both the eye test and on paper, isn’t as bad as we think
The only good thing about Ridder being our QB currently is that it’s possible we won’t have to pay a massive QB contract for the next 5-6 years. Unless we go after a huge Free Agent.. which we shouldn’t. Great time to spend on other positions.
What’s this supposed to say exactly?
I don’t think Ridder is the best but he also hasn’t played enough and doesn’t have the best scheme/pass pro. I think the impatience comes from us having skill players and them not having much to work with. Drake and Pitts on paper should be one of the best receiving duo’s in the league.
This means Ridder is better than a lot of the QBs on there… some of y’all need to learn to read a fucking graph.
Y axis is QB quality – X is offense itself.
Tua and the Dolphins having an insane start to the season
He’s terrible man
Not sure why people are saying the X axis (offensive PFF grade) is the grade for the entire offense. Each player individual player is given an offensive/defensive grade by pff. This week Ridder’s offensive grade was an abysmal 40.8, the worst in the league. This plot is showing Expected Points Added as a function of PFF offensive grade per individual. I’m entirely familiar with how EPA works, but it is an advanced stat that is another way of grading a player’s performance. We are here that PFF grade and EPA are roughly linearly correlated. Specifically for Desmond Ridder, despite having the leagues worst PFF grade (again, this is his grade, not the Falcon offense) he is “only” bottom third in if you consider the EPA metric. Interpret that how you will.