
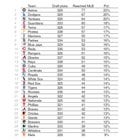
[Jay Cuda] The last 10 years of drafts – % of each MLB team’s picks that made it to the majors (for any team)
The last 10 years of drafts – % of each MLB team's picks that made it to the majors (for any team) pic.twitter.com/skAf1T6vWN
— Jay Cuda (@JayCuda) July 12, 2023
15 comments
Over the last 10 years, the Mets have had the lowest percentage of their draft picks reach the major leagues. The Astros have had the highest percentage of their draft picks reach the major leagues.
Today, David Stearns hired the Astros Director of Amateur Scouting.
Inject this into my veins
Yeah that sounds about right.
Fuuuuuuuuuuck
Does this include guys who were drafted by one team but debuted on another?
Like the Mets drafted Jarred Kelenic but he debuted for the Mariners.
Does he go under the Mets line, Mariners line, or is he not included on this?
Surprised to see the Braves so low.
Farm system is killing it.
God that is stark to see, straight up the worst in baseball at it for the last decade. Excited to see what he and stearns can do, good news for them is literally nowhere to go but up
This raw number doesn’t really tell us a lot. Is there something like accumulated WAR from draft picks that could be more useful?
5 of the bottom 9 are NL East teams
I knew the Mets were booty…I didn’t realize they were the most booty
So many TJ surgeries.
Is there another graph like this that shows the % of draft picks that make it to the majors with THAT team? I know the numbers across the board would be much lower but I’m interested to see by how much
This was posted here during the 2023 season but it’s really not a very good or sensible metric imho.
The most glaring issue is that “total number of players reaching the majors” is a weird threshold to pick. “Reaching the major leagues” doesn’t really mean anything (the Royals had a bunch of their draft picks “reach the major leagues” this year but that’s just because they’re in a rebuild and filling holes with warm bodies). For a Mets example, Josh Walker is a Mets draft pick that “reached the majors” this year at age 28. He threw 10 IP with an 8.10 ERA. That’s not exactly a feather in the cap of anything important. Yeah, he reached the majors, but — is that an example of the system churning out talent?
So this list is basically in large part counting up every single team’s Josh Walkers. You would expect the better drafting teams to have LESS of those, and more guys who made a bigger impact and filled roster slots more consistently (therefore fewer total cumulative in-‘n’-out guys like Josh Walker).
The Mets system has produced impact players comparable to [the best in MLB as you can see in this graph:](https://i.imgur.com/Ix5alqk.gif)
A much better list would be how the Mets fared in fWAR among all draft picks between 2011 and 2020 compared to the other teams in MLB. I don’t have the means or frankly the time to figure out how to do that, but I think that would paint a much better picture. It’s absurd and meaningless to set a guy having 1 PA or IP in the majors as the threshold for success.
Also not mentioned:
– ignores IFAs with which they had a very high rate of success (Rosario, Giménez, Mauricio, Álvarez, Ramírez, Luís Santana [traded for JD Davis])
– ignores that the Mets have never “tanked”, despite some bad seasons, and as a consequence, they only picked in middling or late rounds for almost all of that time (and still produced a lot of impact MLB talent despite the misleading results of this list). Their only top-10 pick in this time span was Kelenic at #6
– most importantly, the fact that this list goes back 10 years, means that the beginning of it is impacted by the last few years of Minaya’s staggering reign of error (the farm system was only just starting to recover from its barren-ness in 2013 and other than deGrom, most of the really good players didn’t debut until like 2015 or later)
thats shockingly bad for a big market team to not invest in scouting. Not surprising it took place under the Wilpon regime.