
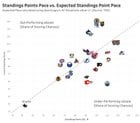
[JFresh] Here’s this week’s look at standings points pace vs. expected pace using SportLogiq’s expected goal differential. (Source: TSN) Teams above the line are outperforming their scoring chance share. Teams below it are underperforming.
Here's this week's look at standings points pace vs. expected pace using SportLogiq's expected goal differential. (Source: TSN)
Teams above the line are outperforming their scoring chance share. Teams below it are underperforming. pic.twitter.com/Nfw2JQk94P
— JFresh (@JFreshHockey) November 20, 2023
1 comment
>Goal differential and standings points are super tightly correlated, so “expected standings points” essentially shows where a team would end up with league-average goaltending and finishing.
>[Here’s the same graph but factoring in points that have been banked already:](https://twitter.com/JFreshHockey/status/1726629172125327862)
SportLogiq uses important data the public models don’t have, so in theory they should be more accurate. Bottom line is that the Sabres skaters need to be better.