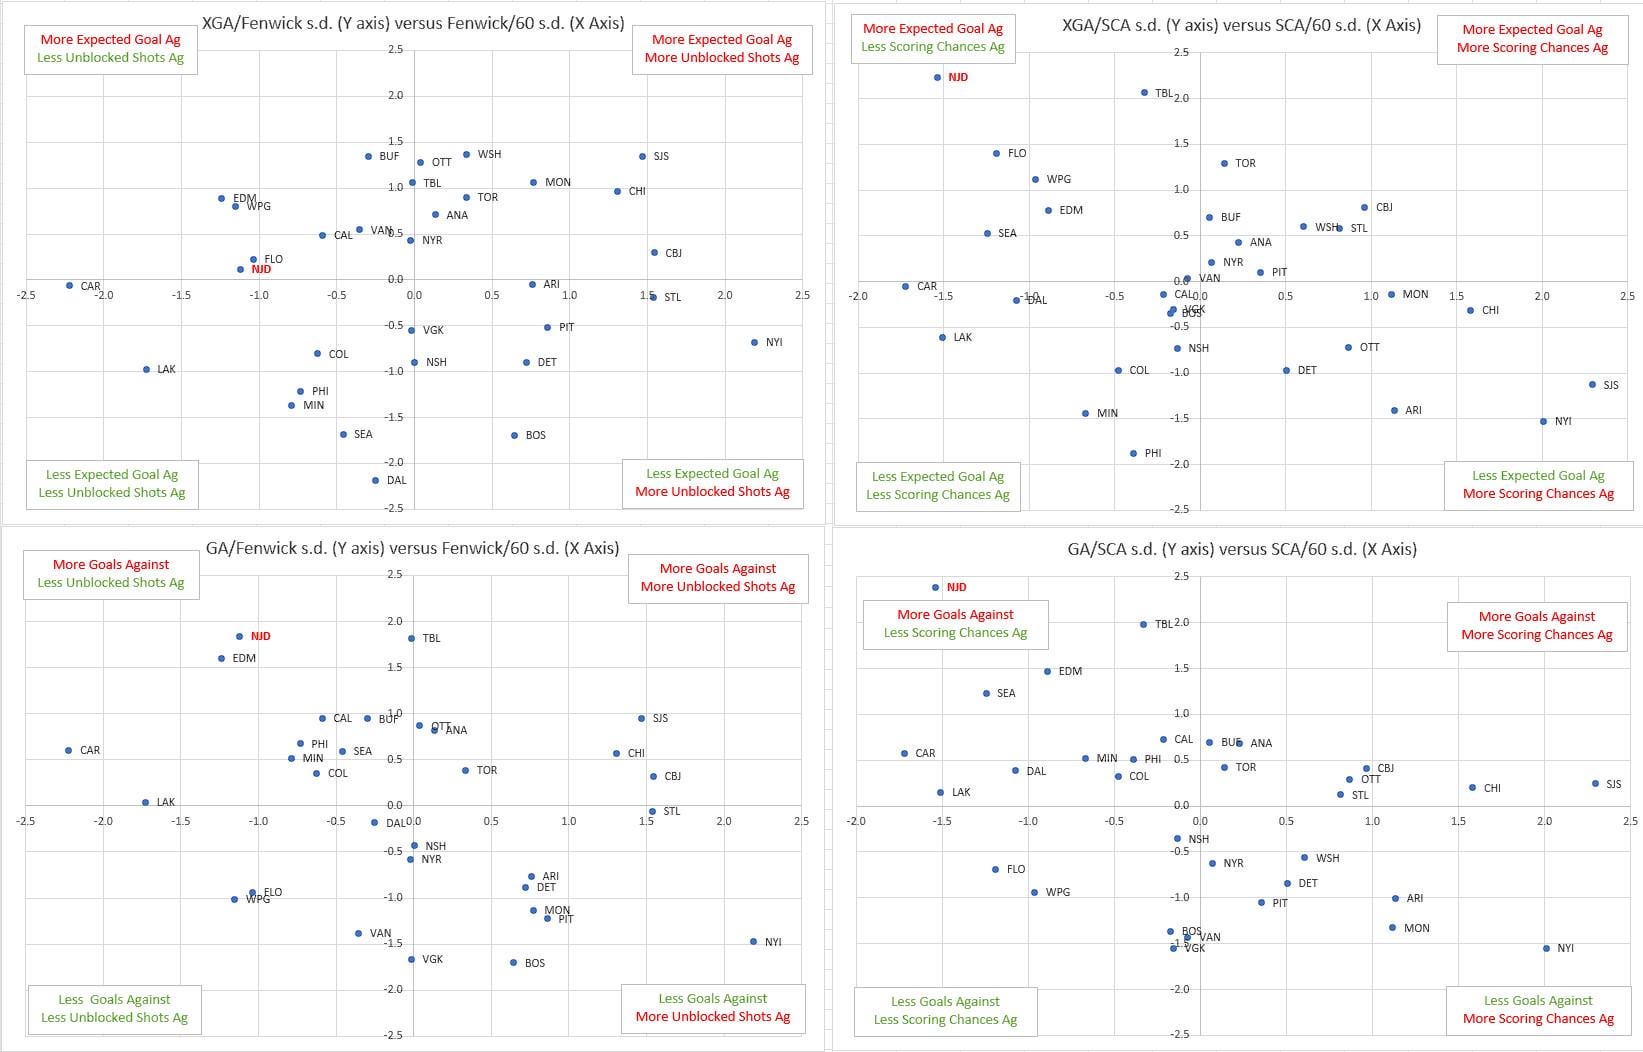
The source is [NaturalStatTrick.com](https://NaturalStatTrick.com) rates (e.g. shots/60, Fenwick/60) for all clubs Season To Date for 2023-24. Top left plots XGA/Fenwick (i.e. unblocked shots) vs Fenwick. Top right plots XGA/Scoring Chances vs Scoring Chances Against. Bottom left is Actual Goals Against vs Fenwick. Bottom right is Actual Goals Against vs Scoring Chances Against. Each axis is normalized via mean and standard deviation – e.g. so -1 represents a standard deviation below average. This data is JUST FOR 5v5 PLAY, to remove any PP/PK 4v4 or EN situations.
So what do we see? Looking at the left 2 charts, the Devils are more than a whole standard deviation lower than average on unblocked shots against, so we are restricting these shots very efficiently. On expected goals against, we should be average for the league (i.e. top left very close to 0 on the Y-axis). Yet looking at actual goals against, we are approaching 2 standard deviations worse goals than average.
Looking at the right 2 charts, of the unblocked shots we give up (Fenwick), even less of these are deemed scoring chances. In fact only Carolina gives up less scoring changes per 60 mins than us. Yet we give up an ungodly 2.4 standard deviations more than average, almost off the chart.
Now look at the difference between XGA and GA relative to Fenwick and relative to Scoring Chances. On Fenwick (i.e. unblocked shots), we should be seeing league average goals against and yet we see way more. On Scoring Chances Against, the expected goal rate is the same as the actual goal rate.
So – the TL;DR… we are giving up much less unblocked shots against, and much less scoring chances than league average, but those we do give up are massively more dangerous than league average, and are getting converted to goals at the expected rate.
I think that this is mostly on our defense strategy, not on the goalies. We need to look at why we are able to suppress so many chances, yet those we give up are super-juicy. It also says that the goalies are doing nothing to help us (i.e. GA is higher than XGA on both scales), but we have deeper issues here.
​
Shoutout to /u/Skylightt for the original work.
I love how the person that actually has a grasp on data gets downvoted. These are great comparisons. I’m still curious if there are any stats that show how many rebounds our goalies give up on average, and relative to their career average. But it’s like the other post pointed out, both of their numbers have dropped similarly. I was team underperforming goalies but this is a good post and I’ve switched

2 comments
My original work, inspired by [https://www.reddit.com/r/devils/comments/18a7j6n/for_the_just_the_goalie_crowd_goalies_arent_great/](https://www.reddit.com/r/devils/comments/18a7j6n/for_the_just_the_goalie_crowd_goalies_arent_great/)
The source is [NaturalStatTrick.com](https://NaturalStatTrick.com) rates (e.g. shots/60, Fenwick/60) for all clubs Season To Date for 2023-24. Top left plots XGA/Fenwick (i.e. unblocked shots) vs Fenwick. Top right plots XGA/Scoring Chances vs Scoring Chances Against. Bottom left is Actual Goals Against vs Fenwick. Bottom right is Actual Goals Against vs Scoring Chances Against. Each axis is normalized via mean and standard deviation – e.g. so -1 represents a standard deviation below average. This data is JUST FOR 5v5 PLAY, to remove any PP/PK 4v4 or EN situations.
So what do we see? Looking at the left 2 charts, the Devils are more than a whole standard deviation lower than average on unblocked shots against, so we are restricting these shots very efficiently. On expected goals against, we should be average for the league (i.e. top left very close to 0 on the Y-axis). Yet looking at actual goals against, we are approaching 2 standard deviations worse goals than average.
Looking at the right 2 charts, of the unblocked shots we give up (Fenwick), even less of these are deemed scoring chances. In fact only Carolina gives up less scoring changes per 60 mins than us. Yet we give up an ungodly 2.4 standard deviations more than average, almost off the chart.
Now look at the difference between XGA and GA relative to Fenwick and relative to Scoring Chances. On Fenwick (i.e. unblocked shots), we should be seeing league average goals against and yet we see way more. On Scoring Chances Against, the expected goal rate is the same as the actual goal rate.
So – the TL;DR… we are giving up much less unblocked shots against, and much less scoring chances than league average, but those we do give up are massively more dangerous than league average, and are getting converted to goals at the expected rate.
I think that this is mostly on our defense strategy, not on the goalies. We need to look at why we are able to suppress so many chances, yet those we give up are super-juicy. It also says that the goalies are doing nothing to help us (i.e. GA is higher than XGA on both scales), but we have deeper issues here.
​
Shoutout to /u/Skylightt for the original work.
I love how the person that actually has a grasp on data gets downvoted. These are great comparisons. I’m still curious if there are any stats that show how many rebounds our goalies give up on average, and relative to their career average. But it’s like the other post pointed out, both of their numbers have dropped similarly. I was team underperforming goalies but this is a good post and I’ve switched