PASSING
6th (570 att) (3978yds 2nd) (34 TD 2nd)
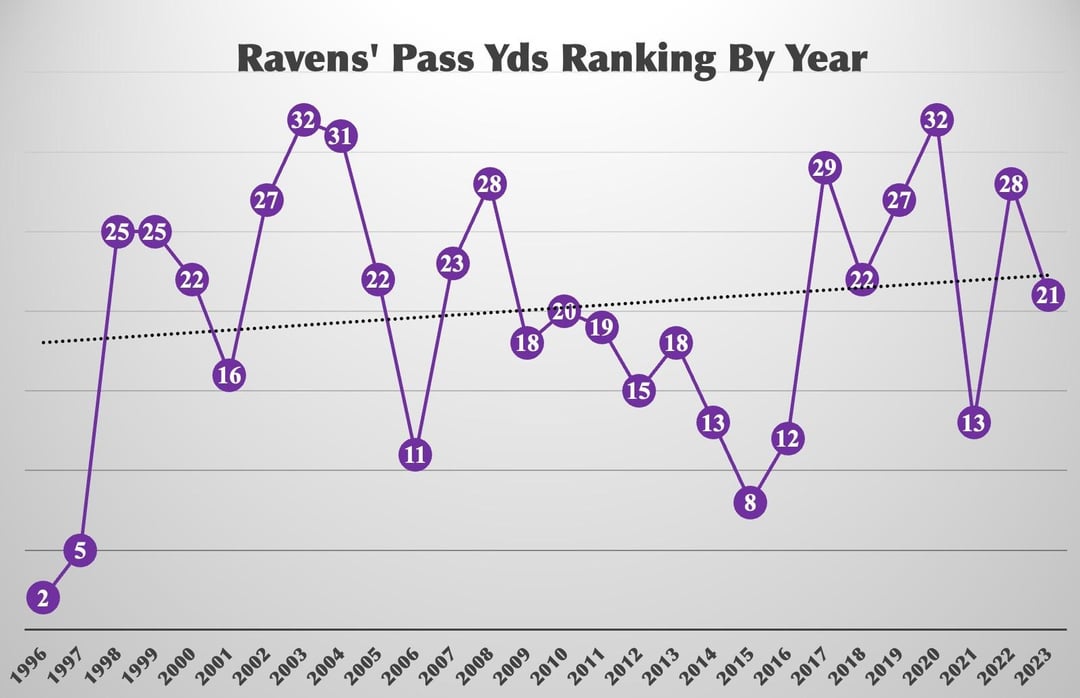
587 att (5th) 3702 yds (5th) 25 TD (8th)
477 att (25th) 2869 yds (25th) 16 TD (25th)
546 att (13th) 3024 yds (25th) 21 TD (15th)
504 att (20th) 2815 yds (22nd) 20 TD (15th)
557 att (8th) 3314 yds (16th) 18 TD (17th)
479 att (26th) 2847 yds (27th) 20 TD (19th)
415 att (32nd) 2255 yds (32nd) 16 TD (27th)
465 att (26th) 2312 yds (31st) 13 TD (30th)
562 att (8th) 3088 yds (22nd) 17 TD (23rd)
524 att (13th) 3435 yds (11th) 21 TD (13th)
557 att (13th) 3035 yds (23rd) 13 TD (28th)
433 att (30th) 2808 yds (28th) 16 TD (22nd)
510 att (25th) 3419 yds (18th) 21 TD (16th)
491 att (25th) 3335 yds (20th) 25 TD (15th)
544 att (18th) 3423 yds (19th) 21 TD (13th)
560 att (15th) 3739 yds (15th) 22 TD (18th)
619 att (8th) 3590 yds (18th) 19 TD (25th)
554 att (17th) 3819 yds (13th) 27 TD (12th)
676 att (1st) 4271 yds (8th) 21 TD (23rd)
679 att (1st) 4100 yds (12th) 20 TD (21st)
567 att (11th) 3030 yds (29th) 20 TD (23rd)
556 att (16th) 3558 yds (22nd) 18 TD (26th)
440 att (32nd) 3225 yds (27th) 37 TD (1st)
406 att (32nd) 2739 yds (32nd) 27 TD (13th)
611 att (9th) 3961 yds (13th) 21 TD (20th)
488 att (28th) 3040 yds (28th) 19 TD (19th)
494 att (30th) 3635 yds (21st) 27 TD (12th)
AVG: 17th in pass attempts, 20th in pass yds, 18th in pass TDs
RUNNING
416 att (24th) 1745yds (14th) 10 TDs (16th)
420 att (24th) 1589 yds (22nd) 7 TD (27th)
408 att (23rd) 1629 yds (20th) 7 TD (25th)
431 att (17th) 1754 yds (16th) 9 TD (20th)
511 att (5th) 2199 yds (5th) 9 TD (24th)
483 att (5th) 1810 yds (11th) 11 TD (14th)
427 att (18th) 1792 yds (16th) 9 TD (26th)
552 att (1st) 2674 yds (1st) 18 TD (5th)
491 att (8th) 2063 yds (9th) 11 TD (17th)
452 att (16th) 1605 yds (21st) 5 TD (30th)
476 att (11th) 1637 yds (25th) 11 TD (22nd)
446 att (13th) 1797 yds (16th) 11 TD (18th)
592 att (1st) 2376 yds (4th) 20 TD (5th)
468 att (7th) 2200 yds (5th) 22 TD (1st)
487 att (6th) 1831 yds (14th) 11 TD (18th)
459 att (8th) 1996 yds (10th) 15 TD (10th)
444 att (12th) 1901 yds (11th) 17 TD (6th)
423 att (18th) 1328 yds (30th) 7 TD (28th)
448 att (11th) 2019 yds (8th) 16 TD (5th)
383 att (25th) 1478 yds (26th) 8 TD (21st)
367 att (30th) 1463 yds (28th) 10 TD (22nd)
460 att (7th) 1856 yds (11th) 14 TD (10)
547 att (1st) 2441 yds (2nd) 19 TD (3rd)
596 att (1st) 3296 yds (1st) 21 TD (2nd)
555 att (1st) 3071 yds (1st) 24 TD (3rd)
517 att (3rd) 2479 yds (3rd) 18 TD (9th)
526 att (7th) 2720 yds (2nd) 14 TD (19th)
541 att (1st) 2661 yds (1st) 26 TD (4th)
AVG: 11th in rush attempts, 12th in rush yds, 15th in rush TDs
PASS/RUN RATIO
1996: 570 pass 416 run (58% pass 42% run)
1997: 587 pass 420 run (58% pass 42% run)
1998: 477 pass 408 run (54% pass 46% run)
1999: 546 pass 431 run (56% pass 44% run)
2000: 504 pass 511 run (50% pass 50% run)
2001: 557 pass 483 run (54% pass 46% run)
2002: 479 pass 427 run (53% pass 47% run)
2003: 415 pass 552 run (43% pass 57% run)
2004: 465 pass 491 run (49% pass 51% run)
2005: 562 pass 452 run (55% pass 45% run)
2006: 524 pass 476 run (52% pass 48% run)
2007: 557 pass 446 run (56% pass 44% run)
2008: 433 pass 592 run (42% pass 58% run)
2009: 510 pass 468 run (52% pass 48% run)
2010: 491 pass 487 run (50% pass 50% run)
2011: 544 pass 459 run (54% pass 46% run)
2012: 560 pass 444 run (56% pass 44% run)
2013: 619 pass 423 run (59% pass 41% run)
2014: 554 pass 448 run (55% pass 45% run)
2015: 676 pass 383 run (64% pass 36% run)
2016: 679 pass 367 run (65% pass 35% run)
2017: 567 pass 460 run (55% pass 45% run)
2018: 556 pass 547 run (50% pass 50% run)
2019: 440 pass 596 run (42% pass 58% run)
2020: 406 pass 555 run (42% pass 58% run)
2021: 611 pass 517 run (54% pass 46% run)
2022: 488 pass 526 run (48% pass 52% run)
2023: 494 pass 541 run (48% pass 52% run)
Conclusions/findings:
Ravens didn’t have a run-first offense until 2000
Only 29% (8/28) of Ravens seasons were run-first: 2000 (the first run-first season), 2003, 2004, 2008, 2019, 2020, 2022, 2023
Of the 22 seasons before Lamar (23 if you count ’19 as his first year), only 4 were run-first
The most pass-heavy season was 2016, where we were 65% pass 35% run.
Ravens weren’t above average in rush attempts until 2000
Ravens were above average (ie above 16th) in rush attempts in 19 of our 28 seasons.
We were top 10 in rush attempts in 15 of our 28 seasons
We were top 5 in rush attempts in 9 of our 28 seasons.
2021 was the only season we’ve been pass-first with Lamar as a starter