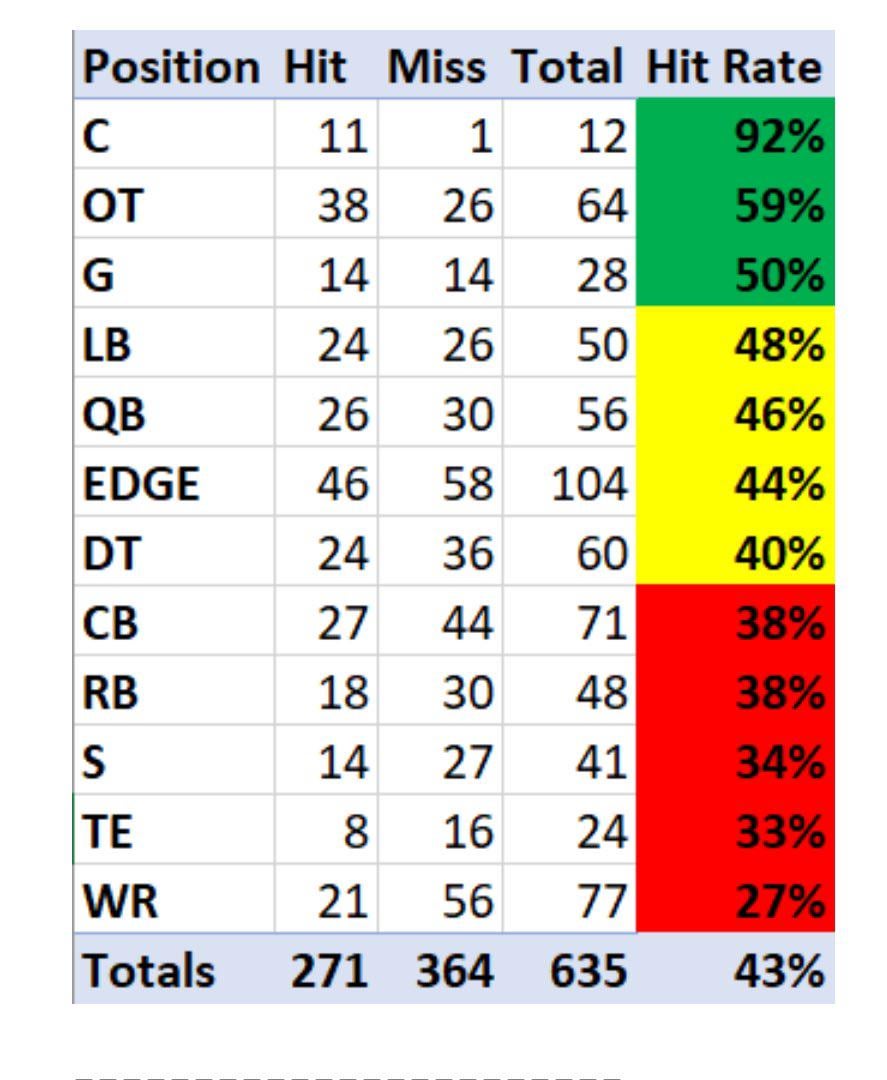
[Schefter] ESPN content producer @PaulHembo calculated the percentage of 1st-round picks that “hit” or “miss,” based upon whether that player signed a second contract with the team that drafted them. The data encompasses the 20 drafts spanning 2000-2019. Here are the positional hit rates:
April 24, 2024
[Schefter] ESPN content producer @PaulHembo calculated the percentage of 1st-round picks that “hit” or “miss,” based upon whether that player signed a second contract with the team that drafted them. The data encompasses the 20 drafts spanning 2000-2019. Here are the positional hit rates:
8 comments
Some of these are skewed though. There’s obviously going to be more WR’s, CB’s and QB’s taken than, say, a C because of the positional importance. You’re only drafting a Center in the first round if he’s a lock, like Ryan Kelly was.
The TE percentage is the most interesting to me though
Very interesting data that probably keeps GM’s up at night leading to the draft. Less than 50% hit rate overall. Surprising, as from reading this subreddit, I thought everyone but the Colts ‘Hit’ in the first round.
These numbers can be taken so many ways
Are more 1st round WRs misses, or are 1st round WRs just easily replaceable?
Do edges actually hit that often, or do teams just hold out hope that they will continue to develop and are worth keeping around?
Also RBs tend to look really good in the first couple years, but they don’t re sign because the wheels start to fall of and easily replaceable
It is worth noting the NFL is good at evaluating, drafting and keeping o line. If you draft an o line early, you assume you have a hit
The qualifier being 2nd contract skews some a bit, but not shocking considering the difference in draft priorities amongst some positions + a position like CB being hard to play.
Guys who I think were fine picks, but are “misses” according to this
Malik Hooker, Coby Fleener, Dwayne Allen, Rock Ya-Sin, Marlon Mack, Okereke, Anthony Walker etc
The bigger the player, the better their chances are.
So really, it’s less risk per pound.
This is totally wrong way to see the data you have divided by top 10 top 15 top 20 the rest, trying to compare a WR taking in the late 20’s Amari Cooper vs Philip Dorsett comes to mind.
These graphs generated by “analyst” are justo generate clicks and bait.
The most shocking part of this entire table to me is the amount of edge rushers taken in the first, almost 30 more than the second highest position.
In other words, if you see a damn near sure fire hit at WR, you trade up to get them. **Hint hint..**