Average WAR for each first round selections in MLB History.
January 4, 2025
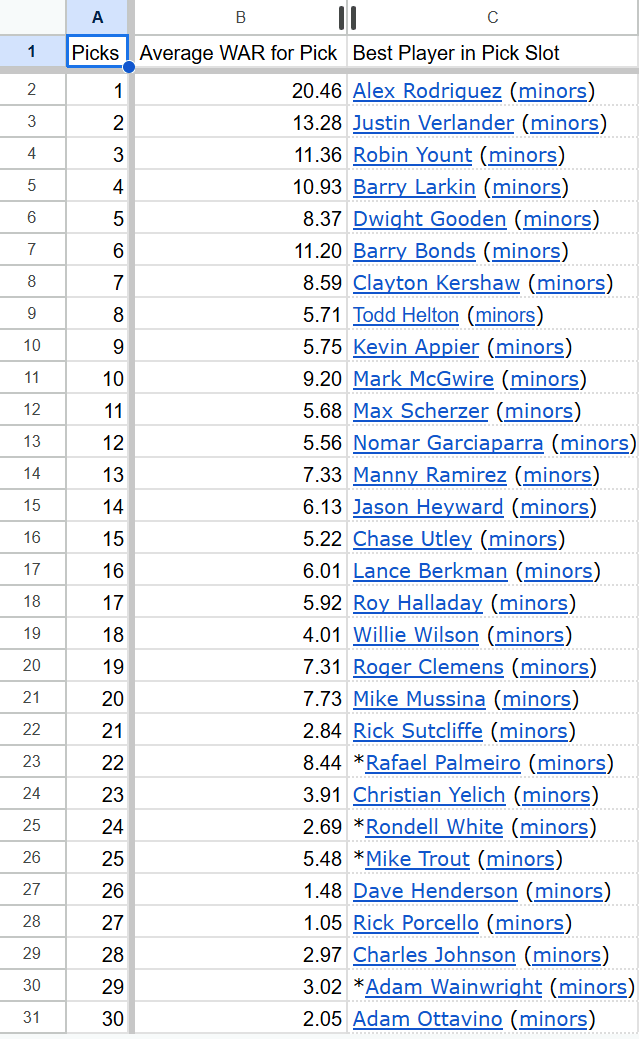
Average WAR for each first round selections in MLB History.
21 comments
Saw your post: u/horsepoop1123 Here is your answers in a sheet for everyone to see.
Player value falls off a cliff after Top-7 and Top-22.
Edit: I really thought there would be a closer comparison between the #1 and top 3, but that isn’t the case. #1 picks are above and beyond much more valuable than 2, 3, etc.
Big Brain White Sox securing the 10th overall pick
Better than the 5th pick
What do the asterisks mean?
The fact that most picks average the career WAR of a mediocre bench player shows how many prospects completely fail to live up to expectations and really drag the average down for the guys who actually find success.
If you’re picking at the end of the first round do yourself a favor and pick an Adam
MLB draft is such a crapshoot compared to the NBA, so many more players fail. When a high pick fails to become a star it’s considered a bust in the NBA. In MLB, tons of high picks never even make the league.
I swear the draft can be so inconsistent. Within the Mariners our first round picks have almost always been crap prior to 2021 and two of our starters are fourth round picks. Just how it goes, I guess.
So (basically) never get too excited about a 27th pick, heard that
I think Mike Piazza’s draft pick number in the 62nd round might have a really high WAR if you only include picks that played in the majors.
This is cool. Can you do median also?
My first thought was that #9 (Kevin Appier) stood out like a sore thumb for worst best player in the top 10, but then I looked it up and he had 51 career fWAR. Still feels totally out of place compared to the rest of the top 10, but I had no idea he had that good of a career.
Helton in different font is driving me crazy
The Yankees basically exclusively draft in the ranges where the average pick produces 1-3 WAR and yet people still say the Yankees are uniquely bad at drafting
thats uh, not very inspiring
What happens if a player never reaches the MLB, do you count as 0 or don’t count it?
How are you calculating the average? This question is because WAR is a accumulative stat, if you have 2 players one with 2 WAR over 1 year of career and one with 20 WAR over 10 years, saying the average WAR is 11 is a bit misleading.
As suggested by other people something better might be to show some percentiles. Like P25, P50, P75, P100
2016 and 2017 1st rounds were comically bad.
One suggestion: use median WAR instead of average. Take three players who have WAR of 3, 3 and 42. I think 3 is more representative than 16 of what the average player did. This is because WAR is going to be a very skewed distribution.
A bonus suggestion: also include who has that median or close to it. It’s interesting not just to see the best case scenario but the average scenario
A bar chart would be a nice addition to this
I feel like a HOFer being in one of the positions is skewing the data too much. Bonds, Palmeiro, and McGwire are causing big spikes out of sequence. This would be more interesting if you remove everything outside of one stdev.
Now do median.
So id much rather pick 10th then 5-9. Gotcha