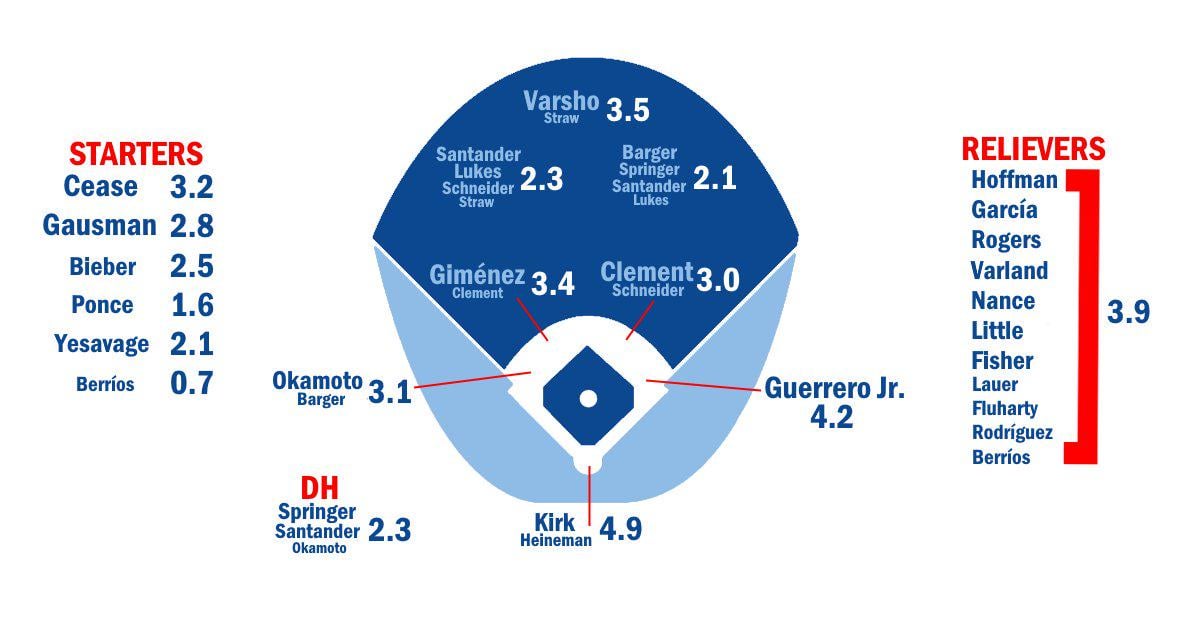
[Szymborski] A sneak peek at the ZiPS x @FanGraphs Depth Chart for the next ZiPS team, the Toronto #BlueJays
January 13, 2026
[Szymborski] A sneak peek at the ZiPS x @FanGraphs Depth Chart for the next ZiPS team, the Toronto #BlueJays
14 comments
what do the number is this mean – is this good
Looks pretty good
A 16 man pitching staff would be impressive
These are bullish numbers. Love it
This is very good – every position is above average to a varying degree. I think the Jays were the only team last year which had this level of Zips production
Very good: 2.0 at every position is excellent, not sure if any other team can boast that
Bad (kind of): no apparent weaknesses makes it harder to focus any spending/upgrades.
Obviously Bo or Tucker are fantastic players but looking at this makes you realize they’re probably only adding ~2 WAR. They should still do it!!
Don’t quote me on this, but I think of all the teams profiles so far, the Jays are only the second (Seattle) to have 4 SP above 2.0 WAR and the only one with 5 above 1.5 WAR.
I really think Berrios isn’t being looked at fairly. He had an injury filled second half of the season and was emotional during the post season. But he’s always been a great work horse and as a 4/5 starter he’s very very good for that role. I think he’ll be better than the world thinks.
Eric Lauer put up a very respectable 9-2, 2.2 WAR year last year with a very good 3.92 SO/BB so he’s an excellent 4/5 type guy. I’m interested to hear how the arms of Garcia’s and Berrios’ arms are doing but there’s solid depth here.
The biggest question marks are also the lowest WAR, which is conservative. Those question marks being Ponce (maybe they’re using his old data here), okamoto (different league), Bieber (injured and recovering), and Berrios they don’t use much anyways
Newer to analyzing stats here – what range of these numbers is considered bad and good?
Damn, that’s sexy!
To my knowledge, the depth chart graphics are balanced for playing time, meaning ZiPS is projecting something in the neighbourhood of 45-46 WAR, or a 93-94 win team before accounting for strength of schedule and all that. For a projection that’s good, considering everyone tends to get pulled towards the middle a bit.
For context, it’s a slightly better total WAR projection than for the Yankees and its neck-and-neck with what’s projected for the Red Sox.
Love what the team has done so far this off season, and projections (ZiPS or otherwise) are highlighting that they lack any obvious weakness, BUT man one more big bat would really help to separate them from the field in this division, especially considering you can’t 100% rule out either the Yankees or Red Sox remembering they’re allowed to sign free agents.
So basically get Tucker over here
Need Tucker more than the air I breath